US broadband penetration broke 80% among active Internet users for the first time in February. Although broadband uptake has slowed over the past two quarters, US broadband growth shows no signs of a saturated plateau. North of the border, Canadians spend more time online than any other country, according to comScore Networks. Canadians view over one-third more web pages than the average US user, holding a 14 point lead in broadband penetration over the US.
Home Connectivity in the US
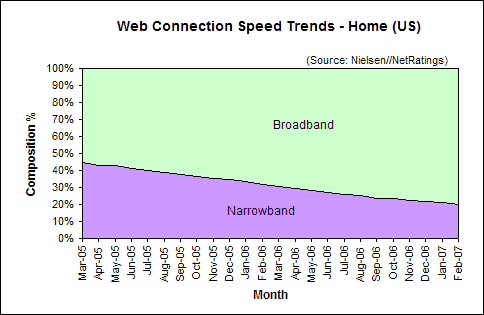
US broadband penetration broke 80% in February 2007, growing to 80.16% among active Internet users. Narrowband users connecting at 56Kbps or less now comprise 19.84% of active Internet users, down 1.09 percentage points from 20.93% January 2007 (see Figure 1).
Web Connection Speed Trends – Home Users (US)
Figure 1: Web Connection Speed Trends – Home Users (US)
Source: Nielsen//NetRatings
Broadband Growth Trends in the US
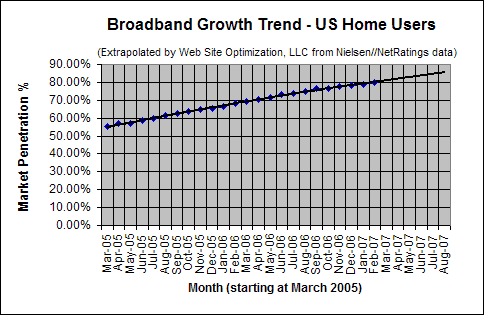
In February 2007, broadband penetration in US homes grew 1.09 percentage points to 80.16%, up from 79.03% in January. This increase of 1.09 points is above the average increase in broadband of 0.87 points per month over the last six months (see Figure 2). Note that while the growth rate has slowed over the past few months, broadband penetration has not yet reached a plateau among active Internet users.
Broadband Adoption Growth Trend – Home Users (US)
Figure 2. Broadband Adoption Growth Trend – Home Users (US)
Extrapolated from Nielsen//NetRatings data
Work Connectivity
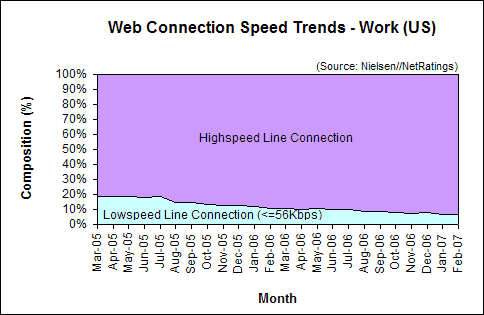
As of February 2007, 93.61% of US workers connected to the Internet via broadband, up 0.31 percentage points from the 93.3% share in January. At work 6.39% connect at 56Kbps or less (see Figure 3).
Web Connection Speed Trends – Work Users (US)
Figure 3: Web Connection Speed Trends – Work Users (US)
Source: Nielsen//NetRatings
Canada, Israel, and South Korea Log Most Time Online
Canada leads all countries surveyed in hours online per month, according to comScore Networks. In fact, according to data provided by comScore, Canadian users outsurf US users by 27% to 72% for average usage days per visitor (per month) and average visits per visitor respectively (see Table 1).
CanadaUSPercent DifferenceCanadaUS
| Broadband | Dial-up | ||||
|---|---|---|---|---|---|
| % Composition Unique Visitors | 88.7 | 74.4 | N/A | 11.3 | 25.7 |
| Total Minutes (MM) | 45,871 | 151.496 | N/A | 2,954 | 31,416 |
| Total Pages Viewed (MM) | 68,902 | 233,352 | N/A | 3,203 | 31,416 |
| Average Usage Days per Visitor | 21.2 | 16.7 | 26.9% | 15.5 | 12.3 |
| Average Visits per Visitor | 92.8 | 53.9 | 72.2% | 38.8 | 26.6 |
| Average Pages per Usage Day | 170.5 | 126.9 | 34.3% | 85.4 | 67.9 |
Source: comScore World Metrix, January 2007
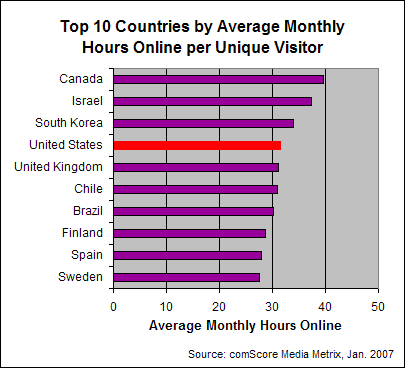
Canadians averaged 39.6 hours per month online overall, with broadband users spending nearly three times more hours online than narrowband users (41.3 hours per month versus 14.2 hours online, see Table 2). Israel came in second at 37.4 hours per month, South Korea at 34 hours, the United States at 31.6 hours, and the UK at 31.2 hours per month (see Figure 4). Overall among the ten countries surveyed, broadband users spent over three times more hours online than narrowband users.
Top 10 Countries for Average Hours Online
Figure 4: Top 10 Countries for Average Hours Online
Source: comScore Networks
Unique Visitors RankAmong All UsersAmong Broadband UsersAmong Narrowband Users
| Average Monthly Hours Online | ||||
|---|---|---|---|---|
| Canada | 9 | 39.6 | 41.3 | 14.2 |
| Israel | 28 | 37.4 | 38.8 | 10.9 |
| South Korea | 6 | 34.0 | 36.1 | N/A** |
| United States | 1 | 31.6 | 37.2 | 13.5 |
| United Kingdom | 5 | 31.2 | 35.6 | 7.5 |
| Chile | 20 | 30.9 | 38.6 | 12.6 |
| Brazil | 11 | 30.2 | 38.5 | 17.0 |
| Finland | 30 | 28.7 | 34.2 | N/A** |
| Spain | 12 | 27.9 | 33.4 | 9.1 |
| Sweden | 21 | 27.5 | 31.4 | 9.7 |
* Excludes traffic from public computers such as Internet cafes or access from mobile phones or PDAs.
** Level of narrowband penetration extremely low, therefore an accurate reportable estimate is not available.
Source: comScore Media Metrix, Home, January 2007
Further Reading
- Nielsen//NetRatings
- Provided the US broadband penetration data for active Internet users for the Bandwidth Report.
- Office of National Statistics
- This UK government department provides official statistics for the public. See their “Focus on the Digital Age” report of March 15, 2007 for a wide variety of demographic statistics about IT usage among European countries including the UK. For example the percentage of broadband connections at home nearly doubled from 2004 to 2006, from 22% to 40%. However, the actual proportion of people who use the Internet appears to have levelled off between 2004/05 and January to April 2006. 18 per cent of adults in Great Britain sold goods over the Internet in 2006, more than double the level in 2003-04. The percentage of all UK businesses (10 employees or more) with a website grew from 58.3% in 2002 to 69.8% in 2005. Most people in Great Britain (over 80%) use the Internet to find information about goods and services and to use email.
- Worldwide Internet Audience has Grown 10 Percent in Last Year, According to comScore Networks
- Canada, Israel, South Korea, United States, and the United Kingdom lead all countries surveyed in online engagement, as measured in average monthly hours online per unique visitor. Broadband users were over 2.5 times more likely to be online than narrowband users. “747 million people, age 15+, used the Internet worldwide in January 2007, a 10-percent increase versus January 2006. Among the top 15 countries (ranked by penetration), Internet audiences in India, the Russian Federation and China increased the most in 2006, growing 33, 21 and 20 percent, respectively. China now represents the second-largest Internet population in the world, with 86.8 million users, after the U.S., which rose 2 percent year-over-year to 153.4 million users age 15 or older in January 2007.” comScore Networks, Inc. March 6, 2007.


