
Although 80% of web performance problems are typically due to front-end issues (Souders 2009), back-end bottlenecks can slow your site down to a crawl. One thing to watch out for is when static pages load relatively quickly, while dynamic pages load slowly. This article shows what to look for when a server slows down a web site.
Web Site Performance Factors
Web site response time is made up of a myriad of factors, including network responsiveness, server response time and load, content size and composition, and client side delays (AJAX, etc.). For optimum web site performance all of these factors should be optimized. For most sites, optimizing the content delivered (and perhaps the hosting) is enough to satisfy users (i.e., combining files, optimizing multimedia, properly caching and compressing files, minifying and trimming, converting to CSS behavior, etc.). However, some sites need more than content optimization, they need server optimization. One possible indicator of a slow server is to look for a slow Time to First Byte (see Figure 1).
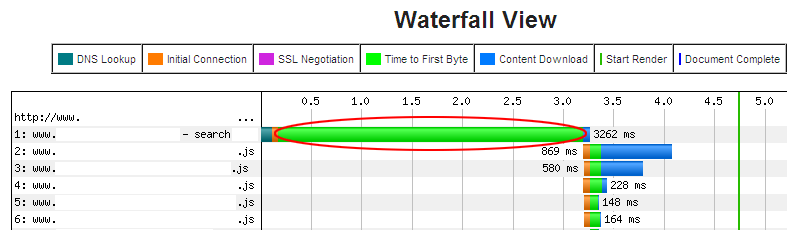
Figure 1: Slow Time to First Byte
Anonymized Webpagetest.org Waterfall Graph Snippet
Time to First Byte
The Time to First Byte is the amount of time it takes after the client sends an HTTP GET request to receive the first byte of the requested resource from the server. Time to First Byte as WebPageTest.org defines is it the time it takes for the browser to wait for the first byte of a requested resource to be received after the DNS lookup and connection time. Some definitions lump DNS, connection and waiting into the TTFB metric. So TTFB represents the amount of time it takes for the server to respond and build the web page.
Figure 1 shows a 3 second time to first byte time over a DSL connection (a search query result page). This is an unusually long delay, normally TTFB is in the range of 0.1 to 0.5 seconds. Users perceive that your web page is slow if you have a slow Time to First Byte, because the start render time will be delayed. This is a form of feedback that users key off of that is routinely measured in website performance studies. A more typical time to first byte is shown for CNN.com in Figure 2. Note that CNN.com uses one minified CSS file followed by one minified JavaScript file.
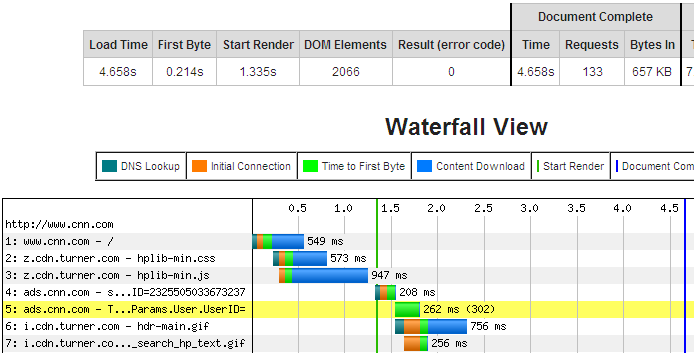
Figure 2: CNN.com Time to First Byte
Webpagetest.org Waterfall Graph Snippet for CNN.com
Distribution of Page Load Components
Web page delay can come from any number of sources. The four metrics at issue here are DNS lookup time (the time to look up the IP address of the domain in question), connection time (the time it takes to set up the TCP connection), wait time (the time it takes to receive the first byte after the connection has been setup (i.e., time to first byte)), and the content download time (the time it takes to download the object). Figures 3 and 4 show the distribution of these four components for 290 top sites tested from a remote connection (Habib & Abrams 2000).
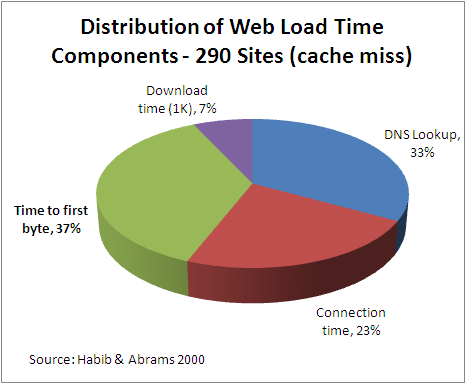
Figure 3: Distribution of Load Time Components (cache miss)
Source: Habib & Abrams 2000
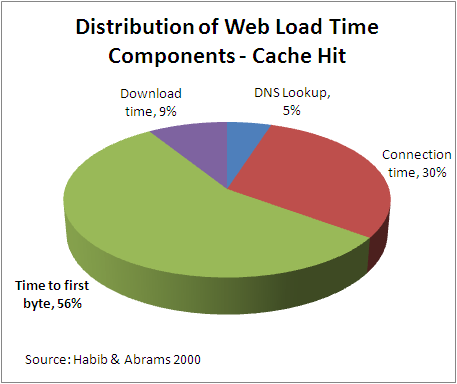
Figure 4: Distribution of Load Time Components (cache hit)
Source: Habib & Abrams 2000
Surprisingly, the Time to First Byte is the largest web page load time component taking 40 to 60% of total web page latency. Overall, Habib and Abrams found that DNS lookup time takes from 10-20%, connection setup time from 20-30%, time to get the first byte takes from 40 to 60%, and content downloading time takes from 10 to 20% of the total page load time. DNS time was signifant in international web sites, and decreased significantly (90+%) on cached resources.
Slow Server Performance Factors
Once you know you’ve got a server performance issue, how do you know what to fix? Here are some server performance issues that may be slowing down your server.
- Memory leaks
- Leaks can accumulate maxing out the memory of your server and slowing it to a crawl. Solution: You can of course increase the memory in your server, but the best fix would be to locate the memory leak and recode the offending script.
- Too many processes / connections
- Programs that keep spawning processes or don’t release server connections can bog down your server response time. Solution: rewrite the code to release resources upon completion.
- External resource delays
- Loading JavaScript or other resources from off-site can cause indeterminate delays for your own site. JQuery, advertising scripts, Google Plus One, Facebook, and other external resources are typically loaded with a remote JavaScript call to Google, Facebook, or some other busy site. Loading infrequently changing resources (like a programming library) remotely introduces DNS and network overhead, and indeterminate delay from a server you don’t control. Solution: Periodically cache the resource locally on your server and serve locally. Use a CRON script to copy the resource.
- Inefficient SQL Queries
- Database queries that are written poorly can cause slowdowns to web sites. Databases that aren’t indexed properly can also cause slowdowns.
- Slow database calls
- Each additional plugin can make calls to a database, which can add up. Solution: Disable any unnecessary plugins in Wordress or your favorite CMS.
- Insuficient server resources
- Low memory, bandwidth caps, or limited disk space can cause paging and poor server response times. Solution: Use VMStat, Top, etc. to locate bottlenecks and either decrease resource usage or increase resources (more memory and disk space can’t hurt).
- Overloaded Shared Servers
- Some hosting companies put too many sites on the same shared server. Servers have limited resources and these can be taxed (memory, processes, bandwidth, etc.) by having too many sites competing for the same resources. Just one heavily loaded site hosted on a shared server can slow down all the other sites hosted there (Our own WebPageAnalyzer.com was kicked off a shared server for that reason). Solution: Move to a lightly loaded shared server, or a dedicated server where you have complete control. .
- Inconsistent website response times
- If your site is slower during different parts of the day (say near lunch time for example), it may be due to increased load on the server slowing down your response time due to maxed out resources (processes, memory, disk space, bandwidth). Solution: Find which resource(s) are highly utilized (CPU, memory, processes etc) during high load and profile and fix “hot code” to help minimize the impact of your scripts. Increasing the resources allocated to your server may help (number of processes for example). A dedicated server may also help here.
Conclusion
You can use the time to first byte metric to help diagnose a slow web server. Studies have shown that time to first byte can dominate web page latency. This article showed an example of slow time to first byte, and some possible causes of slow web server response times.
Further Reading
- Habib, M.A. and M. Abrams, “Analysis of sources of latency in downloading web pages.”
- An investigation into the components of slow web page download times. These Virginia Tech researches found that the Time to First Byte component of web page downloads dominated overseas download time. Proceedings of WebNet, 2000.
- Souders, S. Even Faster Web Sites
- Souders followup book to “High Performance Web Sites” found that 70 to 80% of performance problems are due to the “front end” or content delivered by the server. This book adds more best practices to the 14 detailed in his first book, focusing on Web 2.0 and more advanced techniques. O’Reilly 2009.