Streaming media is hot, but servers and users are even hotter. As higher bandwidth content streams to more bandwidth-hungry users quality of service can suffer. Some industry experts are wondering if the existing infrastructure can scale to handle the load. Meanwhile, the rural-urban broadband gap is closing according to PEW Internet. The US continued its inexorable climb to 66.67% in broadband penetration among active Internet users in January 2006.
Internet Video Growth Spawns Performance Anxiety
As website content increases faster than bandwidth, performance can suffer (King 2003). Users are experiencing degraded VOIP calls, vitiated videos, and slow servers struggling to handle the increased workload. Thousands of popular sites have turned to Content Delivery Networks (CDN) like Akamai (over 80% market share) to help maintain performance. In fact, CDNs report that revenue from streaming video and Internet radio is growing at over 40% per year, with popular sites spending $450 million a year to keep impatient users happy (Pallis & Vakali 2006). However, some experts wonder if CDNs and the Internet can scale to applications like IPTV, where longer higher-bitrate videos (Chung & Claypool 2006) could potentially be watched by millions (Cringely 2006, Borland 2006).
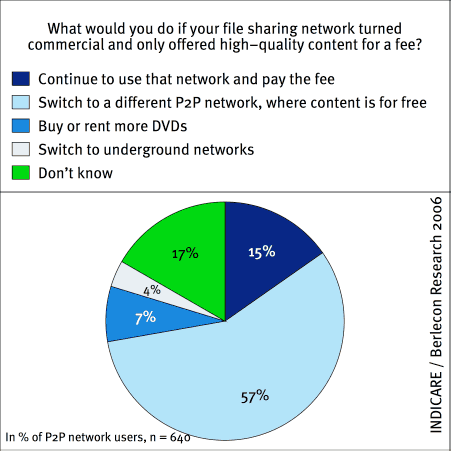
A two-tiered Internet is one stop-gap measure, with prioritized packets passing their lesser brethren over Metcalf’s knee (King 2006). However, as streaming media grows from short clips to long-playing TV shows server process capacity comes into play. P2P networks are one possibility, but some users are reluctant to share their precious computer resources with the major television networks (Slashdot 2006) and pay for P2P content (see Figure 1).
Willingness to Pay for P2P Content
Figure 1: Willingness to Pay for P2P Content
Source: INDICARE.org
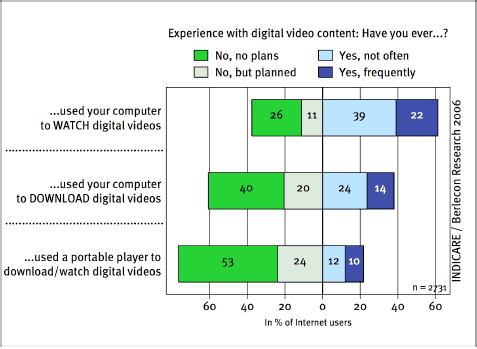
While the volume of digital audio and video stored on the Web is growing at over 100% a year in the US (Borland 2006, Comscore 2005, Li et al. 2005), digital video uptake is at a relatively early stage in Europe, according to INDICARE (Dufft 2006). In a survey of 2,731 European Internet users INDICARE found that while 61% have watched digital videos on their computer, only 22% watch videos frequently (see Figure 2). Portable players such as mobile phones and iPods are used by 22% of those surveyed to watch digital video, while nearly half of these users (10%) watch videos frequently. Apple’s iPod currently dominates the MP3 player market, selling over 3 million songs a day (Clarke 2006).
Digital Video Usage Behavior
Figure 2: Digital Video Usage Behavior
Source: INDICARE.org
Rural-Urban Broadband Penetration Gap Closing
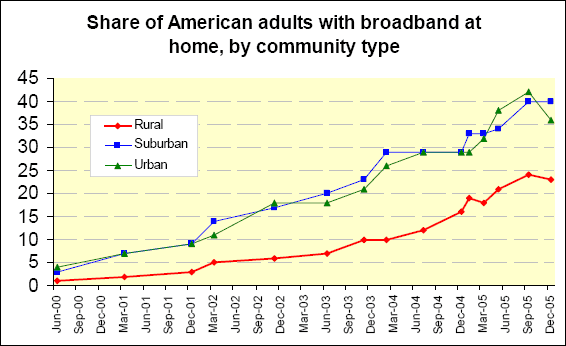
According to a recent survey by PEW Internet the gap between rural and urban high-speed users is closing. While rural Americans lag urban users in broadband penetration, the gap has been closing rapidly in the past two years (see Figure 3). 24% of rural Americans have broadband access to the Internet, while 39% of urban and suburban dwellers have high-speed connections.
Broadband Penetration Trends by Community Type (US Homes)
Figure 3: Broadband Penetration Trends by Community Type
Source: PEW Internet (used with permission)
Home Connectivity in the US
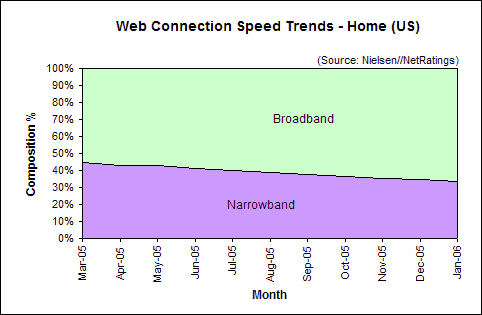
US broadband penetration grew to 66.67% in January. Narrowband users (56Kbps or less) now comprise 33.33% of active Internet users, down 1.1 percentage points from 34.43% in December (see Figure 4).
Web Connection Speed Trends – Home Users (US)
Figure 4: Web Connection Speed Trends – Home Users (US)
Source: Nielsen//NetRatings
Broadband Growth Trends in the US
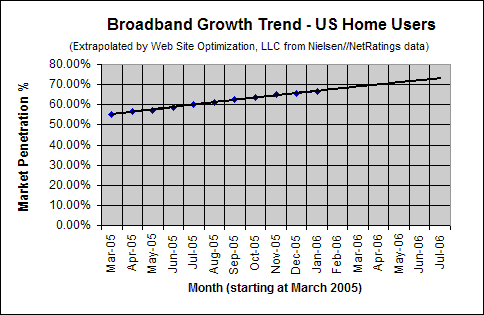
In January 2006, broadband penetration in US homes rose 1.1 percentage points to 66.67% up from 65.57% in December. This increase of 1.1 points is lower than the average increase in broadband of 1.17 points per month over the last six months. At the current growth rate, broadband penetration among active Internet users in US homes should break 70% by mid April of 2006 (see Figure 5). Note that this projection continues to be pushed further into the future with each passing month.
Broadband Adoption Growth Trend – Home Users (US)
Figure 5: Broadband Adoption Growth Trend – Home Users (US)
Extrapolated from Nielsen//NetRatings data
Work Connectivity
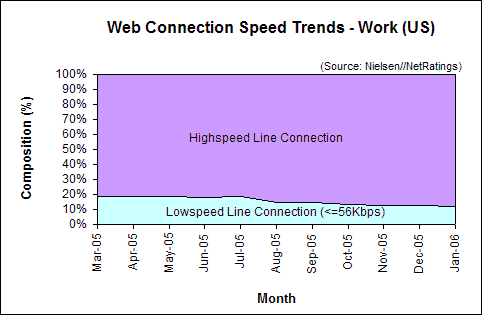
Most workers in the US enjoy high-speed connections to the Internet. Most use a high-speed line such as a T1 connection, and share bandwidth between computers connected to an Ethernet network. The speed of each connection decreases as more employees hook up to the LAN. As of January of 2006, of those connected to the Internet, 87.98% of US users at work enjoy a high-speed connection, up 0.45 percentage points from the 87.53% share in December. At work, 12.02% connect at 56Kbps or less (see Figure 6).
Web Connection Speed Trends – Work Users (US)
Figure 6: Web Connection Speed Trends – Work Users (US)
Source: Nielsen//NetRatings
Further Reading
- Apple Computer’s iPod (2006)
- Apple’s multimedia player dominates the music and video-player market. Apple’s newest iPod plays up to 150 hours of video. In his keynote Macworld address, Steve Jobs announced the availability of hit shows like Saturday Night Live, Lost, and music videos for the iPod.
- Borland, J. (2006) “Net video explosion triggers traffic jam worries“
- More than “60 percent of Internet traffic is being taken up by peer-to-peer swaps, and about 60 percent of those swaps involve video content.” ISPs want to charge content providers for using their networks, but Google and others don’t want to pay. CNET Networks, Inc. News.com, Feb. 23, 2006.
- “CDN Market Share: A Complete Business Analysis 2004 and 2005”
- Accustream iMedia Research; researchandmarkets.com
- Chung, J. and Claypool, M. (2006), “Empirical Evaluation of the Congestion Responsiveness of RealPlayer Video Streams“
- “While voice quality audio typically operates over a narrow range of bitrates (32-64 Kbps), video operates over a much wider range of bitrates. Video conferences and Internet videos stream at about 0.1 Mbps, VCR quality videos at about 1.2 Mbps, broadcast quality videos at about 2-4 Mbps, studio quality videos at about 3-6
Mbps, and HDTV quality videos at about 25-34 Mbps.” Thus with the trend towards higher quality videos the demand for bandwidth will continue to increase. This paper measured the responsiveness of RealVideo over UDP by measuring the performance of multiple streaming video clips with varying bandwidth bottlenecks, and analyzed the “TCP-Friendliness” of the UDP streams. Accepted for publication in Kluwer Multimedia Tools and Applications. - Clarke, G. (2006), ‘”If you can find a better iPod, buy it,” says Apple’s Jobs‘
- Steve Jobs claims that Apple has sold 42 million iPods, with 32 million sold in 2005 alone. Apple is selling iTunes at a rate of 3 million a day, giving it a market share of 83% according to The Register, Jan. 10, 2006.
- comScore Networks, (2005), “State of the Consumer Streaming Market,”
- In measuring a representative cross-section of 1.5 million US consumers Comscore found that “more than 100 million users consume online digital media (streams and downloads) in the U.S. in a month, which represents almost 60 percent of the U.S. online population (97.5 million computers).” Middle-aged consumers between the ages of 35 and 54 years old accounted for more than 45 percent of all online videos watched in August 2005. comScore Networks/Streamingmedia.com, Dec. 1, 2005.
- Cringely, R. (2006), “Rules of the Road“
- “Internet Growth is Slowing, So We Instinctively Seek New Ways of Growing and New Rules to Make It Happen.” Robert Cringely notes that while growth is slowing, Metcalf’s Law still applies. TV is moving to the Internet in order to connect more devices to increase its value. No data center is large enough to handle “millions of HDTV unicasts” so peer-to-peer distributed systems like Grid Networks come into play. Can these networks scale? Robert X. Cringely, Feb. 23, 2006, PBS.org.
- Dufft, N. et al., (2006), “Digital Video Usage and DRM: Results from a European Consumer Survey,”
- In a survey of 2,731 European Internet users INDICARE found that while most Internet users have watched digital videos on their computer (61%) only 22% watch video content frequently. INDICARE.org, Feb. 23, 2006.
- Horrigan, J. (2006), “Home Broadband Adoption in Rural America” (PDF)
- Found that rural users are closing the broadband penetration gap with urban and suburban users in the US. Pew Internet & American Life Project, Feb. 26, 2006, http://www.pewinternet.org/pdfs/PIP_Rural_Broadband.pdf, accessed on Feb. 27, 2006.
- King, A., (2003), Speed Up Your Site
- The size of the average web page tested is increasing faster than bandwidth. Response times tracked by Keynote are slowing down over time as web sites pack on the bytes.
- King, A., (2006), “Telcos Tout Two-Tier Internet“
- Telecommunications companies are lobbying Congress to create a two-tier Internet where their own services would have higher priority than their competitors. Web Site Optimization, LLC, Dec. 19, 2005
- Li, M., Claypool, M., Kinicki, R., and Nichols, J., (2005), “Characteristics of Streaming Media Stored on the Web”
- in ACM Transactions on Internet Technology (TOIT) 5, no. 4(2005):601-626. Using a custom “Media Crawler” the Worcester Polytechnic researchers analyzed 17 million representative URLs to characterize multimedia clips on the Web. They found that more than half of streaming media clips are video, encoded mainly for broadband connections, at resolutions smaller than typical monitors. As of early 2003, RealMedia clips dominate other clips with 63% share, with Windows at 32%, and QuickTime at 5% of all streaming clips analyzed. Over 54% of audio clips analyzed were in RealMedia format, while over 98% of QuickTime clips were videos. The authors conclude that the “total volume of streaming media stored on the Web has increased by over 600% in the past five years (1997-2003). Moreover, the fraction of streaming media objects stored on the Web relative to other objects has increased by more than 500%.”
- Nielsen//NetRatings
- Provides the US broadband data (percentage of active Internet users) for the Bandwidth Report.
- Pallis, G. and Vakali, A. (2006), “Insight and Perspectives for Content Delivery Networks”
- “Striking a balance between the costs for Web content providers and the quality of service for Web customers,” Communications of the ACM, v. 49:1, Jan. 2006. Provides a high-level overview of CDNs. The authors suggest that caching, personalization, and data mining are key to the future evolution of CDNs. Includes some statistics on CDNs.
- Shashdot (2006), “Cringely on P2P vs Streaming Data Centers,”
- A discussion on Robert Cringely’s article where some express concern over sharing their computer’s resources for video streaming P2P networks. VA Software, Slashdot.org, Feb. 25, 2006
*Note that Nielsen//NetRatings new NetSpeed report differs from the previous Web connection data in two ways. First NetSpeed determines the connection speeds of the Digital Media Universe, which combines Web traffic, Internet applications and proprietary channels. The old Web connection data was based solely on Web traffic. The other difference is that the old Web connection data was based on panelists where the linespeeds are known. Since linespeeds don’t change often, if a panelists has an unknown linespeed, their previous month’s speed is taken.
The Bandwidth Report is featured monthly on URLwire – news of useful and unique web content since 1994.

