
US broadband penetration growth dropped from 15th to 17th place worldwide, from June 2007 to December 2007. Overall, US broadband penetration remained at 15th place among all countries surveyed, according to the OECD. The slower growth of US broadband appears to be due to a lack of choice for consumers, an overreliance on cable, and low DSL and fiber penetration. Meanwhile, US broadband penetration rose 0.43 percentage points to 89.3% among active Internet users.
US Broadband Growth Drops to 17th Worldwide
The US fell from 15th to 17th place in broadband growth worldwide, from June 2007 to December 2007. Compared to the rest of the world, the US has dropped in rankings from an above average increase of 4.2 high speed inhabitants in the year ending Q2 2007, to an average increase of 3.08 inhabitants in the year ending Q4 2007 (see Figure 1).
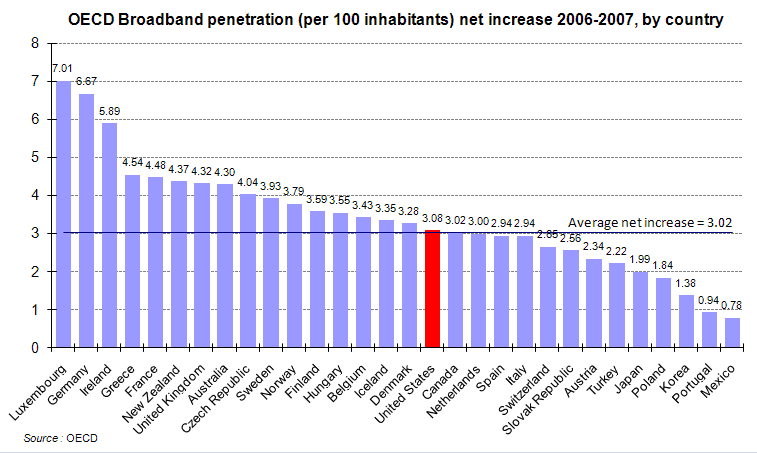
Figure 1: Net increase in broadband penetration by country
Source: OECD
US Broadband Penetration Remains at 15th Worldwide
The United States remained at 15th in broadband penetration worldwide, according to the OECD (see Figure 2). The latest December 2007 data showed no change in rankings since the June 2007 broadband penetration report. Iceland jumped from 6th to 3rd place, while Switzerland dropped from 3rd to 6th place. Australia dropped from 12th to 16th, while Germany rose from 16th to 14th place worldwide.
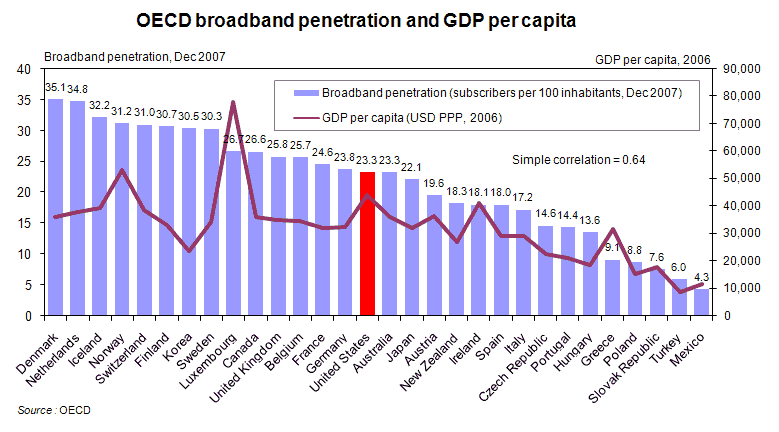
Figure 2: Worldwide Broadband Penetration by Country (subscribers per 100 inhabitants)
Source: OECD
Worldwide Broadband Penetration by Technology
The composition of US broadband shows that cable makes up the majority of broadband subscribers (see Figure 3). Cable constitutes 12 subscribers per 100 inhabitants in the US, while DSL makes up 10 subscribers per 100 inhabitants, and fiber makes up only 0.6 subscribers for a total of 23.3 broadband subscribers per 100 inhabitants. In contrast to the US, thirteen of the fourteen countries ahead of the US in penetration use DSL for the majority of their broadband connections. Only Korea has a lower DSL penetration rate of 9.5, however Korea also has a fiber penetration rate of 10.4 broadband subscribers per 100 inhabitants. So the slow growth of US broadband appears to be due to underutilized DSL and fiber technology, and an overreliance on cable to provide broadband.
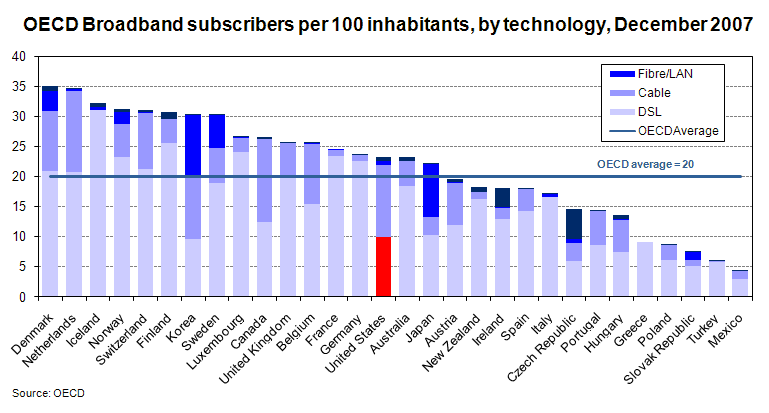
Figure 3: Worldwide Broadband Penetration by Country by Technology
Source: OECD
We talked to Taylor Reynolds, co-author of the OECD study, about why the US is lagging behind in broadband penetration.
“The US has one of the most innovative Internet economies in the world but broadband penetration is just slightly above average in the OECD. It’s not a matter of broadband coverage since most US households can purchase cable broadband and only slightly less can purchase DSL. There must be something else to the story.
The US has fewer broadband choices available, in general, than other countries where unbundling is in place. In the US you can typically choose between DSL and cable. However, in countries such as the Netherlands and Belgium you can choose between Cable + DSL01 + DSL02 + DSL03 + DSL04. That’s because the incumbent telecommunication operator in these countries is required to rent the copper loop to competitors for residential and business services. The way the DSL providers distinguish themselves from one another is often via price and speed. That could help explain why maximum advertised speeds in the US are often lower than those we find in other countries and prices for high-end services are relatively expensive. – Taylor Reynolds, OECD.org
Percentage of Fiber Connections in Total Broadband Subscriptions
Figure 4 shows that Japan (40%), Korea (34%), and Sweden (18%) lead all countries surveyed in their percentage of fiber broadband connections. The US had only 3% of its broadband subscribers on optical fiber connections in December 2007.
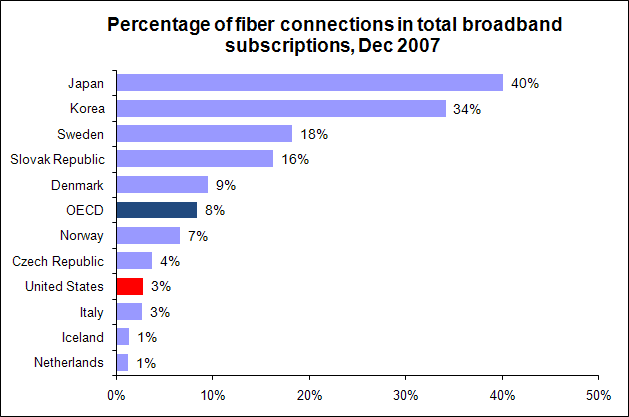
Figure 4: Percentage of fiber connections of total broadband subscriptions
Source: OECD
Historical Broadband Penetration Rates by Country
Figure 5 shows the overall broadband penetration rankings over the past six years for OECD countries worldwide. Denmark (35.07), the Netherlands (34.78), Iceland (32.18), Norway (31.22), and Switzerland (30.97) lead all countries in broadband penetration. Canada came in 10th at 26.59 broadband subscribers per 100 inhabitants, followed by the UK at 11th at 25.78, and the US came in 15th at 23.3% of the population on broadband.
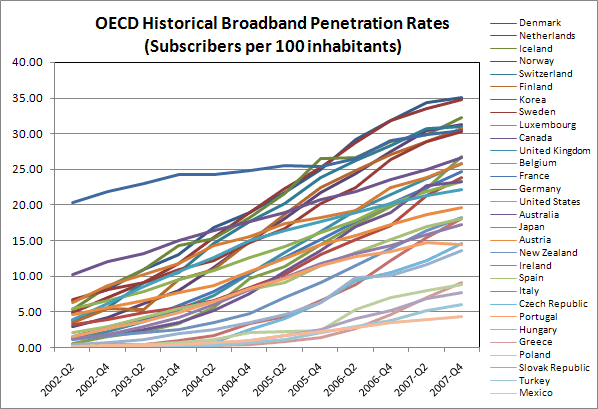
Figure 5: Historical broadband penetration rates by country
Source: OECD
Among the G7 countries, Canada still leads with 26.6% of the population on broadband, followed by the UK at 25.8%, France at 24.6%, Germany at 23.8%, the US at 23.3%, Japan at 22.1%, and Italy at 17.2% of inhabitants subscribing to broadband (see Figure 6). Since the last broadband survey in June 2007, the US has dropped one place to 5th at 23.3% behind a surging German at 23.8%.
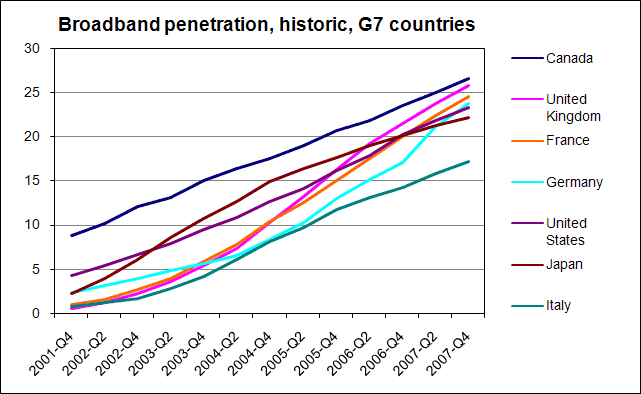
Figure 6: Historical broadband penetration rates for G7 Countries
Source: OECD
Home Connectivity in the US
US broadband penetration grew to 89.25% in April 2008. Narrowband users connecting at 56Kbps or less now make up 10.75% of active Internet users, down 0.43 percentage points from 11.18% in March 2008 (see Figure 7).
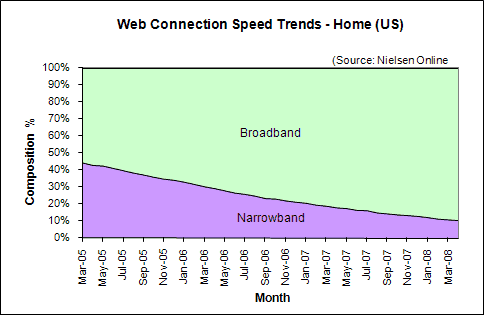
Figure 7: Web Connection Speed Trends – Home Users (US)
Source: Nielsen Online
Broadband Growth Trends in the US
In April 2008, broadband penetration among active Internet users in US homes grew by 0.43 percentage points to 89.25%, up from 88.82% in March. This increase of 0.43 points is below the average increase in broadband of 0.59 points per month over the last six months (see Figure 8). At current growth rates, broadband penetration among active Internet users will break 90 percent by May or June of 2008.
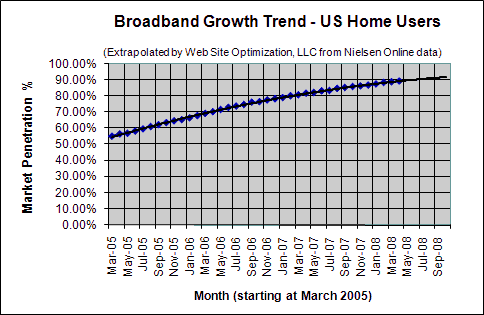
Figure 8. Broadband Adoption Growth Trend – Home Users (US)
Extrapolated from Nielsen Online data
Work Connectivity
As of April 2008, 95.64% of US workers connected to the Internet with broadband, down 0.19 percentage points from the 95.83% share in March. At work, 4.36% connect at 56Kbps or less (see Figure 9).
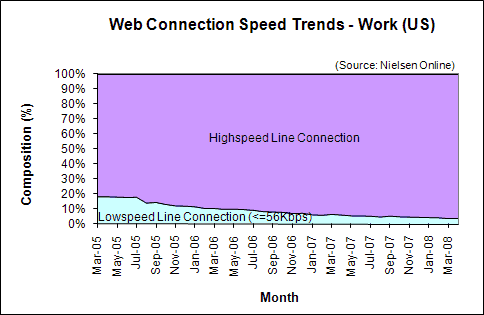
Figure 9: Web Connection Speed Trends – Work Users (US)
Source: Nielsen Online
Further Reading
- Nielsen Online
- Provided the US broadband penetration data for active Internet users for the Bandwidth Report.
- Organisation for Economic Co-operation and Development
- The OECD’s May 19, 2008 report provided the data for this month’s bandwidth report (Dec. 2007 survey)..