
The use of broadband in the US has risen dramatically over the past decade, growing nearly 7-fold from 2001 to 2009 (see Figure 1). However, there are disparities among different socio-economic groups. The US Department of Commerce recently released a report analyzing these “broadband adoption gaps” to highlight where the private sector and the US government can focus their efforts to bring broadband access to all Americans (NTIA 2010).
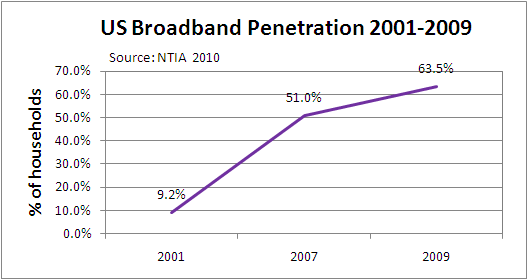
Figure 1: US Broadband Penetration by Household, 2001, 2007, and 2009
Source: NTIA/US Department of Commerce
Summary of Findings
The NTIA report used data from a special 2009 supplement to the Census Bureau’s Current Population Survey, which asked questions about the use of broadband Internet of more than 50,000 households. The highlights of the study are:
- About 7 out of 10 households use the Internet at home in 2009. The majority of which access the Internet using broadband.
- Income and education are strong determinants of broadband use at home, but are not the sole factors.
- Broadband adoption was higher among White and Asian households than Black and Hispanic households. Differences in socio-economic attributes did not, however, explain the gap in broadband adoption associated with race and ethnicity.
- Urban households were more likely to use broadband than rural households, even after accounting for socio-economic differences.
- Home broadband adoption of the disabled lagged those households without a disability by a significant margin, however all but 5% of this gap is explained by differences in socio-economic and geographic differences.
Broadband Adoption Gaps for Race and Ethnicity
The report analyzes the differences in broadband adoption between various socio-economic groups. Broadband adoption among non-Hispanic White households was 68% in 2009, above the national average. Broadband adoption for non-Hispanic Black households was 49%, and 48% for Hispanic households, implying a gap of 19 percentage points between White and Black households, and 20 percentage points between White and Hispanic households. However, once you control (through a regression analysis to isolate different factors) for socio-economic and geographic attributes (urban vs. rural for example) the White-Black adoption gap drops to 10 percentage points, and the White-Hispanic adoption gap drops to 14 percentage points (see Figure 2). The shorter bar in each section of Figure 2 shows the remaining unexplained adoption gap after accounting for differences in household demographic, socio-economic, and geographic characteristics. These
remaining gaps suggests that the differences associated with race and ethnicity are not entirely explained by differences in income or other non-income attributes.
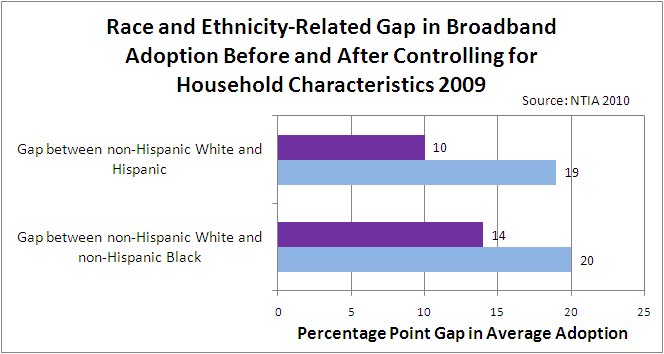
Figure 2: Race and Ethnicity Broadband Adoption Gaps – 2009
Source: NTIA/US Department of Commerce
Urban versus Rural Broadband Adoption Gap
Urban households
average broadband Internet usage rates of 66% while rural households average 51% in broadband adoption, a 15 percentage point urban-rural gap in broadband Internet usage. About half of this gap is accounted for with differences in socio-economic and demographic characteristics. An adoption gap of 7 percentage points remains between urban and rural dwellers even after controlling for differences in income, education, race, ethnicity, age, household size, foreign-born status, disability status, and state of residence (see Figure 3).
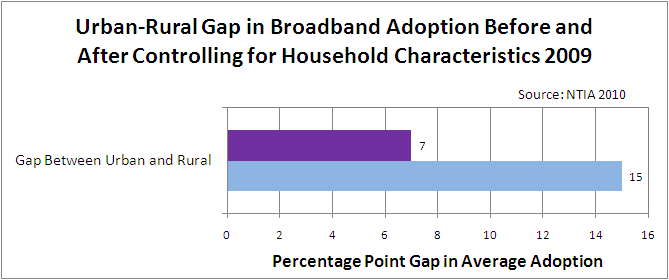
Figure 3: Urban Rural Broadband Adoption Gap – 2009
Source: NTIA/US Department of Commerce
The Broadband Adoption Gap for Disabled and non-Disabled Americans
The average broadband Internet adoption rate for households headed by someone with a disability was 38% in 2009,
and 68% for households headed by someone with no disability, implying a 30
percentage point adoption gap. The adoption gap declines to 5 percentage points after controlling
for socio-economic and geographic characteristics (see Figure 4), implying that the vast majority of the
adoption gap associated with disability is explained by differences in these factors.
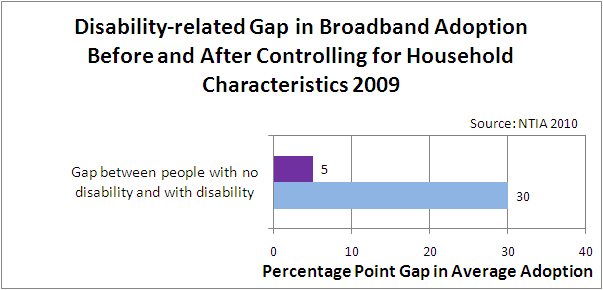
Figure 4: Disability Broadband Adoption Gap – 2009
Source: NTIA/US Department of Commerce
Conclusion
Broadband adoption in the US has made great strides over the past decade, increasing by nearly 7 fold from 2001 to 2009. However, there are gaps between various socio-economic groups that are holding back the promise of universal access to broadband. This report shows that these gaps, when viewed as raw data, can be misleading. After controlling for other household characteristics (race, ethnicity, income, geographic region, etc.) to isolate the household characteristic in question these gaps narrow, sometimes substantially (in the case of disability for example). This report shows that raw broadband data should not be viewed or compared in isolation without controlling for other household characteristics.
Further Reading
- Exploring the Digital Nation: Home Broadband Internet Adoption in the United States
- The US Commerce Department is tasked with reporting accurate data on broadband adoption within the United States. This latest report, prepared by the Economics and Statistics Administration, the National Telecommuinications and Information Administration and the U.S. Department of Commerce, shows the growth in broadband over time (2001, 2007, and 2009), differences among socio-economic groups, all based on Census 2009 data. This study draws on the Census Bureau’s Current Population Survey Internet Use Supplement, a
survey of approximately 54,000 households conducted over one week in October 2009. Published This report explores the “adoption gaps” found in a previous report, by performing regression analysis on the data to isolate the effect of individual factors. November 2010.