
Each year, the FCC is tasked with reporting on the state of broadband adoption in the United States as compared to the rest of the world. The FCC’s second International Broadband Data Report presents comparative data from multiple sources on the extent of international broadband service capacity based on the best data available. The report found that there is a significant correlation between broadband adoption and income, population, and population density, with the strongest correlations from GDP and population density.
Correlations Between Demographic Factors and Broadband Adoption
The FCC report culled data from a number of sources for the US and countries worldwide, including data from the OECD. The report analyzed the relationship between various demographic factors, including GDP, population size, population density, and level of education. They performed a regression analysis of the data to look for trends and relationships, controlling for the other factors. The analysis suggests a positive correlation between broadband adoption and income, population density, and population size. The strongest predictors of broadband adoption were GDP and population density.
“A 10% increase in the number of people per square kilometer corresponds to a 0.15 percentage-point increase in the percentage of households with broadband connections, and a 10% increase in per capita GDP corresponds to a 1.53 percentage-point increase in the
percentage of households with a broadband connection.”
These factors help explain the rates of US broadband adoption as compared to the rest of the world. “Based on OECD data, the United States ranks ninth for
mobile broadband adoption on a per capita basis and 12th for fixed (e.g., DSL or cable) broadband on a
per household basis. U.S. fixed broadband adoption lags behind such countries as South Korea, the
United Kingdom, Canada, and Germany, but exceeds adoption rates in Japan and the EU average.” Figure 1 shows the uncoordinated scatter plots for the regression analysis.
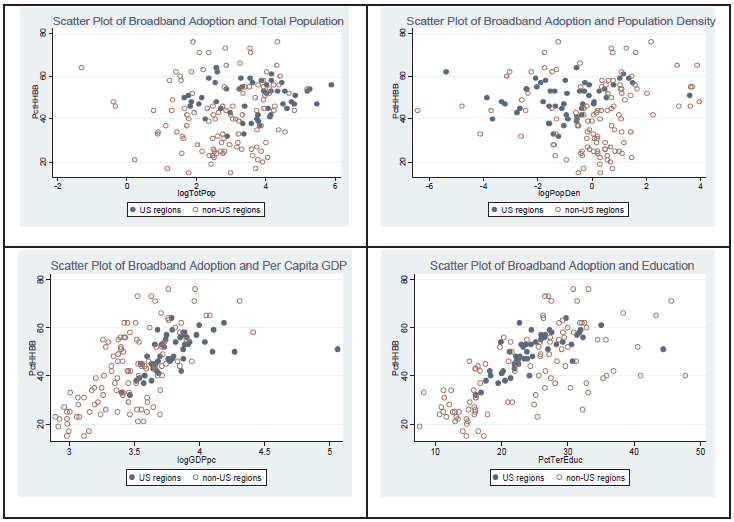
Figure 1: Broadband Adoption Scatter Plots for Demographic Factors
Source: FCC
Surprisingly, the FCC’s model did not find a statistically significant relationship between education and broadband adoption.
Further Reading
- International Broadband Data Report – FCC
- FCC report for the International Comparison Requirements Pursuant
to the Broadband Data Improvement Act, May 20, 2011.