
With Google now factoring page loading speed into search engine rankings, having a fast website has become even more important. Exactly how much of a factor speed is in search rankings is open to debate, although anecdotal evidence suggests that speed can affect rankings. One of the first steps companies need to take in improving their website speed is a web performance audit. This article details what to expect in a web performance analysis.
What is a Web Performance Audit?
A web performance audit is an independent analysis of the factors that contribute to the response time of a website. In addition to measuring the size and rendering speed of the various components that make up a web page, a web performance audit should offer recommendations to speed up the response time of initial and subsequent page loads. Depending on its depth, a web performance audit can also include optimized code examples to replace older less efficient code (XHTML, CSS, JavaScript, and backend PHP, Perl, Java, etc.).
Performance audits come in two flavors, front-end and back-end. Front-end audits are more common than back-end because about 80% to 90% of the time users wait for pages to load are spent on the front-end (Souders 2007). Back-end audits are still useful for performance because you can potentially gain orders of magnitude improvements in performance from back-end optimization. A front-end audit typically includes the following:
Front-End Web Performance Analysis
- Executive summary with overall recommendations
- Baseline performance benchmarks (useful for tracking progress and competitive analysis)
- Detailed analysis of individual web pages
- Baseline metrics (XHTML, CSS, JavaScript, multimedia size, page load speed [first byte, start render, page load times])
- Triaged recommendations (listed in order of effectiveness) for both page components and server settings
- Code review with optimized examples of first instances of problem areas (XHTML, CSS, and JavaScript)
- Optional: AJAX-specific analysis (code review, unused functions, proper library, compression, server settings])
Back-End Web Performance Audit
A back-end audit explores the factors that effect the delivery of the front-end content. Back-end audits typically review server setups, CMS and module configuration, and SQL query efficiency. An example outline of a back-end audit follows:
- Executive summary with overall recommendations
- Baseline performance benchmarks and server setup
- Identify server configuration, middleware, and CMS and module setup/versions
- Recommend improvements for above factors (upgrades, caching, compression, middleware)
- Locate target pages with profiling/monitoring tools
- Identify slow database queries using SQL profiler
- Show which SQL queries to optimize
- Show where to create indexes for any full table scans
Hybrid Performance Audit
A hybrid performance audit combines both front-end and back-end analyses into one complete report. Hybrid audits analyze the two main components that contribute to web page speed, the server configuration that delivers the content to the user, and the content itself and how quickly the content renders.
What about Web Performance Tools?
Automated performance tools like YSlow, Page Speed, and WebPageAnalyzer.com can give you some useful metrics and guidelines. Performance experts use these and other tools to analyze your site, review your code in detail, and triage and implement recommendations.
Common Performance Problems
What can you expect to find when reviewing a site for web performance? Here are some common performance problems we’ve found when reviewing web sites.
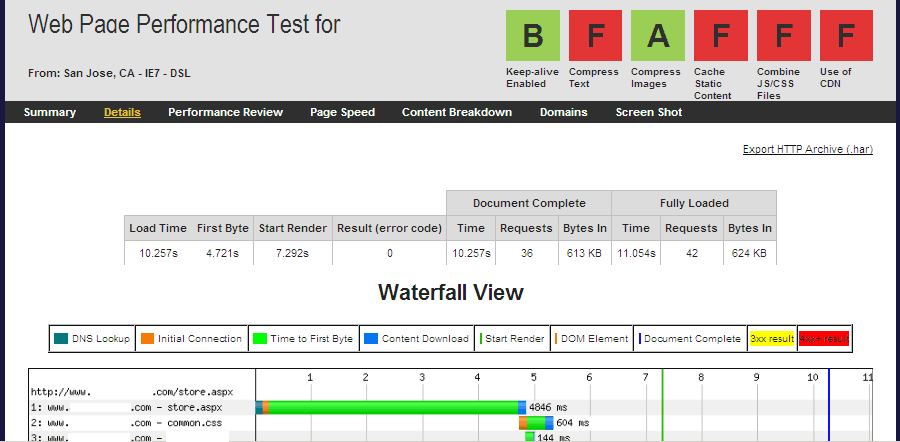
Long Time To First Byte
Figure 1 shows an example of a long time to deliver the first byte, over 4 seconds before any data is sent. This delays the time for the display of useful content. A long TTFB indicates a server performance issue, typically from an overloaded shared or dedicated server.
Figure 1: Long Time to First Byte (WebPageTest.org waterfall)
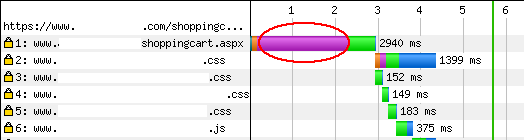
Slow SSL Connection/Handshake
For secure transactions you often see a slow SSL connection (see Figure 2). Secure Sockets Layer handshakes are resource intensive and can slow down https pages. One solution is to offload SSL connections to a specialized server.
Figure 2: Long SSL Connection (WebPageTest.org waterfall)
Blocking of Content by JavaScript
When browsers load and execute JavaScript they stop other rendering duties including downloading other resources. Misplaced JavaScript (typically placed after CSS instead of before), can block the downloading of subsequent files. Here is an example where JavaScripts were placed between CSS files (see Figure 3), note the misplaced CSS file after a JavaScript file.
Figure 3: Misplaced JavaScript Blocks Parallel Downloads (WebPageTest.org waterfall)
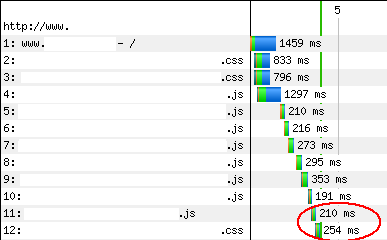
Too many external files in the HEAD
With the average web page requiring more than 43 objects per page
object overhead now dominates web page latency. Multiple objects (external JavaScript and CSS files typically) within the HEAD of XHTML documents are particularly harmful to web page performance because they delay the rendering of useful body content that users can interact with. See Figure 3 for an example. One solution is to combine JavaScript files into fewer files, and do the same for CSS. Another solution is to “split the payload” and load only the CSS and JavaScript required by the page (before the onload event) and defer loading of the rest of the JavaScript and CSS after the body content loads (by attaching a node say with JavaScript after the onload event fires).
Overweight JavaScript
One trend that we’re seeing lately with the advent of Web 2.0-enabled pages is the growth of JavaScript. Libraries like jQuery, Prototype, YUI, and Dojo are used and combined with other behavior (menus in particular) to create more interactive and responsive web interfaces. Unfortunately, all of this JavaScript has to be downloaded and parsed. We’ve seen total JavaScript payloads larger than 500K! A couple solutions present themselves, compress the JavaScript (with GZIP or deflate) which typically compresses these text files by 75% to 80%. Even better, combine and minify the JavaScript files before compression. The best solution is to rethink the behavior of the page in question, and substitute standards-based methods (CSS drop-down menus for example) for JavaScript.
Unused or Legacy CSS
One of the useful metrics that Page Speed gives is an indication of how much of the CSS is actually referenced in a target web page. In recent analyses we’ve found a fair amount of CSS going unused within pages and sites. To combat CSS bloat remove legacy CSS left over from past designs, and adopt a more object-oriented approach ala Nicole Sullivan (see OOCSS.org for more information).
Removed unused CSS
45% of CSS (estimated 31.7kB of 70.4kB) is not used by the current page.
Uncompressed Textual Content
HTTP compression is a standards-based way to compress the textual content of your web pages. HTTP compression or “content encoding” uses GZIP and deflate to compress your XHTML, CSS, and JavaScript at the server, and modern browsers decompress these files automatically to speed up web page downloads and save bandwidth. Even though on average HTTP compression can save 75% or more off of textual files, only 66% to 89% of compressible text is compressed on the Web (Ramachandran 2010).
You can test your site for HTTP compression using the above tools or Web Page Analyzer or Port80Software.com tools.
Unoptimized Images and Multimedia
On average images make up 64.3% of the average web page size, and more than 75% of all HTTP requests, so optimizing images is one of the first places to start when speeding up web pages. While lossy methods can significantly reduce web image sizes, not everybody wants to change the quality of their images. You can losslessly trim unnecessary bytes and blocks from your images using a tool like Smushit from Yahoo! (see Figure 4)
Figure 4: Shushit Losslessly Optimizing Images

Complex XHTML Code
The XHTML provides the skeleton to display the objects in a web page. Making this skeleton lightweight is one key in fast web page display. Overuse of tables for layout and embedded styles and JavaScript are two common problems. One thing to avoid is saving HTML files from Word files. Word outputs a large amount of unnecessary code:
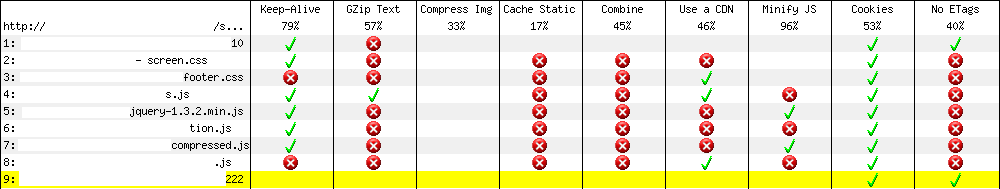
Improper Server Settings
You can detect certain server settings without requiring access to the server, typically using HTTP headers. Caching, keep-alive, HTTP compression, etags usage, cookies on static resources, and other settings can be detected remotely. Figure 5 shows the optimization checklist from WebPageTest.org, which is an online version of AOL’s PageTest open source program.
Figure 5: Optimization Checklist Showing Items to Address (WebPageTest.org Optimization Checklist)
Conclusion
With speed now factoring into web page rankings, web performance has suddenly become more important. A web performance audit can show where problem areas are and recommend solutions. This article shows what to expect from a web performance audit. There are two main kinds of performance audits, front-end and back-end. The majority of analyses are front-end, although back-end audits can often reveal significant areas for improvement. We showed some common problems found in websites today, and list some tools used by performance engineers.
Further Reading
- The Average Web Page
- Shows data for the average top 500 web page and the average web page for the entire web. The average web page as of May 2010 was 320K with 43.9 resources.
- HTTP Compression
- Standards-based way to compress textual content in a web page using GZIP or deflate. Typical compression savings are 75%.
- King, A. 2008, “Website Optimization: Speed, Search Engine & Conversion Rate Secrets“
- Half of this book is devoted to improving web site performance. Includes a chapter on web metrics and performance tools. By Andrew B. King. O’Reilly.
- Ramachandran, S. 2010, May 26, “Web metrics: size and number of resources,”
- Using the Googlebot, Sreeram analyzed both 380 million top sites and 4.2 billion websites to see what the average web page consists of. He found that the average web page is 320K in size, using 43.91 resources per page.Just 66% of compressible bytes were compressed using HTTP compression in the entire Web. 64.3% of the average web page was taken up by images (205.99K of images divided by 320K size of average web page). There were 7 scripts and 3.2 external style sheets. The uncompressed size of the top sites was 477.2K, while the uncompressed size of the average web page (4.2 billion) was 376.7K. Interestingly, the top sites network size (bytes delivered down the pipe) was smaller (312K vs. 320) than the overall average web page, due in part to the increased used of HTTP compression (89% versus 66%). Google, May 26, 2010.
- Souders, S. 2007, “High Performance Web Sites“,
- Using his experience as a back-end engineer at Yahoo! Steve Souders wrote his first book on web performance gives 14 rules to follow to speed up your site by 25 to 50%. Each rule is explained and tested with matching live tests on the companion site. O’Reilly.
- WebPageTest.org
- A web-based version of AOL’s Page Speed program. Gives waterfall charges of resource loading sequences, optimization checklist of major problem areas, and timings at different network locations and bandwidths of page loading metrics.