
In our April bandwidth report we reported that the US dropped to 15th out of 30 countries surveyed by the OECD. The Information Technology and Innovation Foundation (ITIF) says that the broadband penetration data reported by the OECD is not an adequate measure of a nation’s relative position in broadband technology. The ITIF suggests that adding speed and price to the equation would show a more complete picture of a nation’s broadband rankings. Calculated in this way the US ranks 12th in global broadband penetration, two spots behind Canada at 10th overall (see Table 1). Turkey paid the highest price for high-speed broadband at $115.76 per month while Japan paid the least for high-speed broadband service at $0.27 per month.
The OECD data was also questioned by Market Clarity recently, a “telecommunications intelligence” firm based in Australia. Not surprisingly Australia came out ahead in the Market Clarity report. The OECD responded with questions of their own about Market Clarity’s methodology.
“Market Clarity’s omission of current, official data sources and subsequent estimation of broadband totals undermines the statistical validity of the report’s findings. In addition, Market Clarity has chosen to adopt a different methodology for counting broadband (e.g. including 3G) than the OECD but then applies it inconsistently. Finally, Market Clarity is also inconsistent across countries in how it attempts to remove connections slower than 256 kbit/s.” – Source: OECD
Table 1: ITIF Broadband Rankings – Top 20 OECD Countries
| Rank | Nation | Penetration | Speed | Price | Overall Score |
|---|---|---|---|---|---|
| Subscribers per Household | Average Speed (mbps) | Price per Month for 1 mbps, Fastest Technology (USD PPP) | |||
| 1 | Korea | 0.90 | 45.6 | 0.45 | 15.73 |
| 2 | Japan | 0.52 | 61.0 | 0.27 | 14.99 |
| 3 | Iceland | 0.83 | 6.0 | 4.99 | 12.14 |
| 4 | Finland | 0.57 | 21.7 | 2.77 | 12.11 |
| 5 | Netherlands | 0.73 | 8.8 | 4.31 | 11.87 |
| 6 | Sweden | 0.49 | 18.2 | 0.63 | 11.54 |
| 7 | France | 0.49 | 17.6 | 1.64 | 11.41 |
| 8 | Denmark | 0.70 | 4.6 | 4.92 | 11.37 |
| 9 | Norway | 0.64 | 7.4 | 4.04 | 11.29 |
| 10 | Canada | 0.62 | 7.6 | 6.50 | 11.11 |
| 11 | Belgium | 0.54 | 6.2 | 6.69 | 10.60 |
| 12 | US | 0.51 | 4.8 | 3.33 | 10.47 |
| 13 | Switzerland | 0.68 | 2.3 | 21.71 | 10.40 |
| 14 | Australia | 0.50 | 1.7 | 2.39 | 10.23 |
| 15 | Austria | 0.42 | 7.3 | 5.99 | 10.08 |
| 16 | Portugal | 0.42 | 8.1 | 10.99 | 9.92 |
| 17 | UK | 0.50 | 2.6 | 11.02 | 9.92 |
| 18 | Germany | 0.38 | 6.0 | 5.20 | 9.81 |
| 19 | Italy | 0.38 | 4.2 | 3.36 | 9.78 |
| 20 | Luxembourg | 0.51 | 3.1 | 18.48 | 9.71 |
US Passes Canada in Broadband Penetration
In our last annual US versus Canada broadband survey we found the US fast approaching Canada for broadband penetration among home users. As of March 2007, the US passed Canada in home broadband penetration (see Figure 1). Note that this data is from two different sources, who measure broadband penetration differently. Our US data is for active Internet users, which inflates the figures somewhat. However, the trends show that Canada appears to have reached a plateau in broadband penetration growth while US broadband uptake is still growing.
US versus Canadian Broadband Penetration Over Time
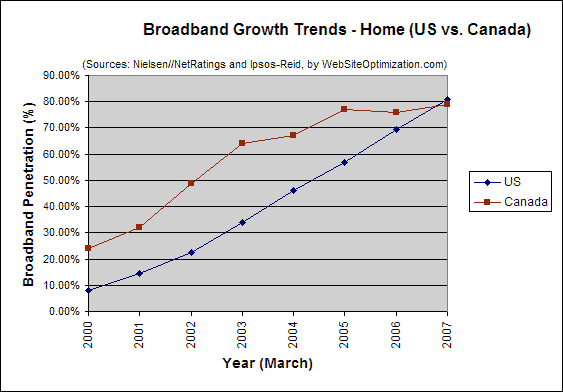
Figure 1: US versus Canadian Broadband Penetration Growth (home users)
Source: Nielsen//NetRatings and Ipsos Reid
Home Connectivity in the US
US broadband penetration grew to 81.76% among active Internet users in April 2007. Narrowband users connecting at 56Kbps or less now make up 18.24% of active Internet users, down 0.95 percentage points from 19.19% March 2007 (see Figure 2).
Web Connection Speed Trends – Home Users (US)
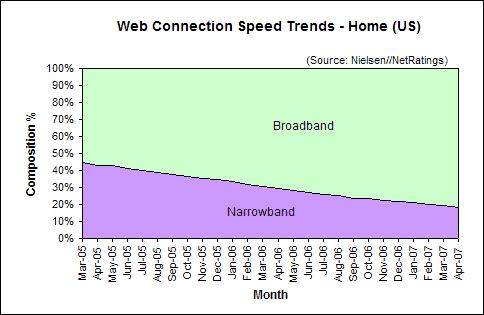
Figure 2: Web Connection Speed Trends – Home Users (US)
Source: Nielsen//NetRatings
Broadband Growth Trends in the US
In April 2007, broadband penetration in US homes grew 0.95 percentage points to 81.76% up from 80.81% in March. This increase of 0.95 points is above the average increase in broadband of 0.75 points per month over the last six months (see Figure 3).
Broadband Adoption Growth Trend – Home Users (US)
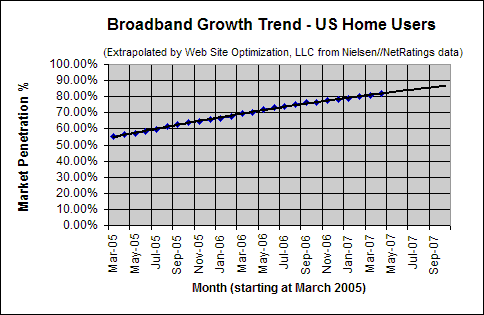
Figure 3. Broadband Adoption Growth Trend – Home Users (US)
Extrapolated from Nielsen//NetRatings data
Work Connectivity
As of April 2007, 93.46% of US workers connected to the Internet with broadband, up 0.43 percentage points from the 93.03% share in March. At work 6.54% connect at 56Kbps or less (see Figure 4).
Web Connection Speed Trends – Work Users (US)
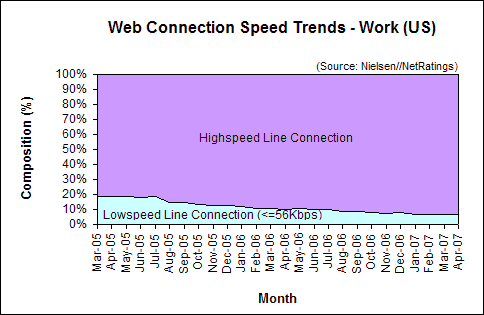
Figure 4: Web Connection Speed Trends – Work Users (US)
Source: Nielsen//NetRatings
Further Reading
- The Information Technology & Innovation Foundation (ITIF)
- “Assessing Broadband in America: OECD and ITIF Broadband Ranking,” recalculated OECD broadband penetration data to take into account speed and price. April 2007.
- Market Clarity
- The “Broadband Wars: The OECD’s International Broadband Arms Race” report disputes the accuracy of the OECD’s June 30, 2006 assessment of broadband markets in member countries. The OECD rebutted their arguments, questioning the methodology of Market Clarity. May 16, 2007.
- Nielsen//NetRatings
- Provided the US broadband penetration data for active Internet users for the Bandwidth Report.
- The Organisation for Economic Co-operation and Development
- Provides the twice-yearly OECD Broadband Statistics for 30 member countries.