
The UK will pass Canada in broadband penetration for the top spot among G7 countries in 2008. The UK’s higher growth rate will propel them past Canada in late 2008, according to projections by Website Optimization. While the US showed a higher growth rate in year over year broadband uptake, it remains in 15th place worldwide in broadband penetration. Japan and Korea now have more broadband subscribers on fiber than on DSL or cable. Among active Internet users, broadband penetration in the US grew to 91.8% in September 2008, up 0.26 percentage points over last month.
UK to pass Canada in Broadband Penetration in 2008
Among G7 countries, Canada has held the top spot in broadband penetration for many years. The UK, however, is adding subscribers at a faster rate of 16.5% versus Canada at 12.9% growth from Q2 2007 to Q2 2008 (see Table 1 and Figure 1). As of Q2 2008 Canada had 27.9 broadband subscribers per 100 inhabitants, followed closely by the UK with 27.6 subscribers. France had 26.4 subscribers per 100 inhabitants, followed by Germany with 26.2, the United States with 25.0, Japan with 23.0, and Italy with 18.2. At current growth rates, the UK will pass Canada in Q3 2008 for the top spot among G7 countries in broadband penetration (see Figure 1).
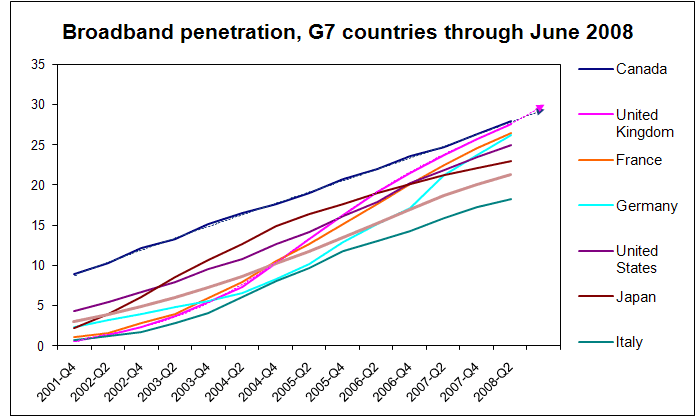
Figure 1: Historical broadband penetration rates for G7 Countries (extrapolated)
Source: OECD
| Country | 2006-Q2 | 2006-Q4 | 2007-Q2 | 2007-Q4 | 2008-Q2 |
|---|---|---|---|---|---|
| Canada | 21.9 | 23.6 | 24.7 | 26.3 | 27.9 |
| United Kingdom | 19.2 | 21.4 | 23.7 | 25.8 | 27.6 |
| France | 17.6 | 20.1 | 22.4 | 24.6 | 26.4 |
| Germany | 15.1 | 17.1 | 21.2 | 23.8 | 26.2 |
| United States | 17.9 | 20.3 | 21.9 | 23.6 | 25.0 |
| Japan | 19.0 | 20.2 | 21.3 | 22.2 | 23.0 |
| Italy | 13.1 | 14.2 | 15.8 | 17.2 | 18.2 |
| OECD | 15.1 | 17.0 | 18.6 | 20.0 | 21.3 |
| EU 15 | 16.3 | 18.4 | 20.8 | 22.7 | 24.4 |
US Broadband Growth Rate Jumps from 17th to 12th Place Worldwide
The US jumped from 17th to 12th place in net broadband growth worldwide, from December 2007 to June 2008. Compared to six months ago, the growth in subscribers per 100 inhabitants has increased from 3.08 about the OECD average of 3.02 to an above average rate of 3.13 subscribers added per 100 inhabitants (see Figure 2). This rate of 3.13 is just behind Canada at 3.21. Luxembourg leads all countries in net increase in broadband growth at 6.05 from June 2007 to June 2008, followed by Germany at 5.03, Greece at 4.13, Ireland at 4.12, and Hungary at 4.10 additional subscribers per 100 inhabitants.
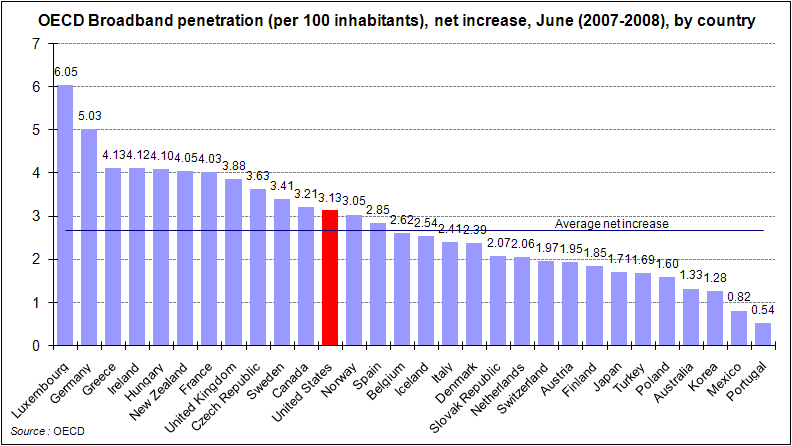
Figure 2: Net increase in broadband penetration by country
Source: OECD
US Broadband Penetration Remains at 15th Worldwide
The United States remained at 15th in broadband penetration worldwide, according to the OECD (see Figure 3). The latest June 2008 data showed no change in rankings since the December 2007 broadband penetration report. Iceland dropped from 3rd to 5th place, while Finland dropped from 6th to 8th place worldwide. Broadband penetration appears to correlate with GDP per capita (0.67 simple correlation), while broadband penetration does not appear to strongly correlate with population density (0.21 simple correlation). However, a scatter plot of the broadband data does show a rough correlation between broadband penetration and population density (see Figure 4).
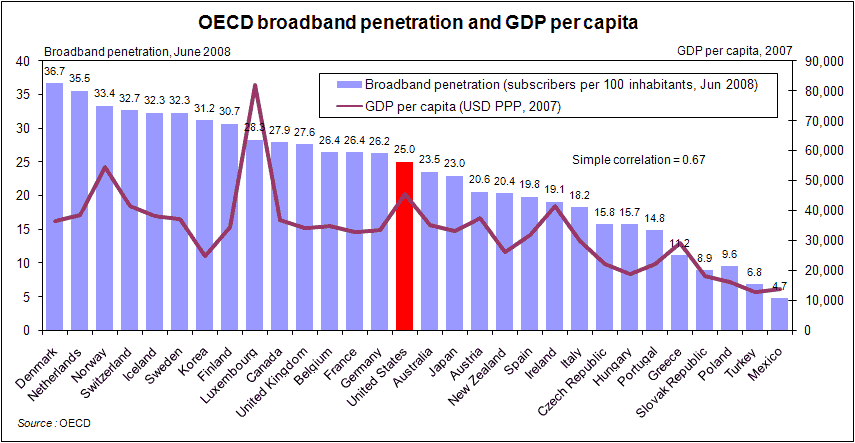
Figure 3: Worldwide Broadband Penetration by Country (subscribers per 100 inhabitants)
Source: OECD
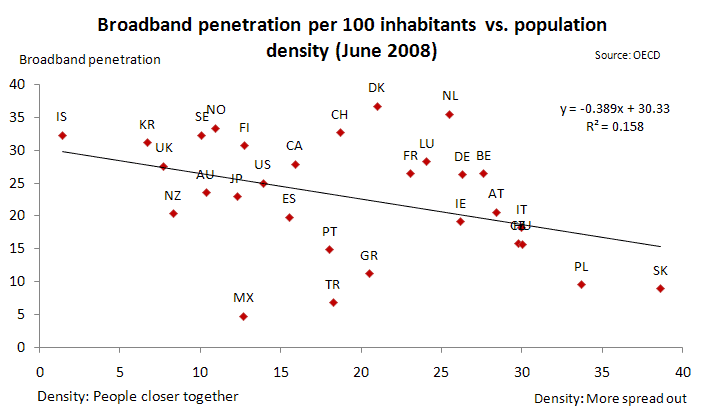
Figure 4: Broadband Penetration versus Population Density Scatter Plot
Source: OECD
Worldwide Broadband Penetration by Technology
Cable continues to make up the majority of broadband subscribers in the US (see Figure 5). Cable constitutes 13.2 subscribers per 100 inhabitants in the US (52.3% of broadband subscribers), while DSL makes up 10.1 subscribers per 100 inhabitants, and fiber makes up only 0.9 subscribers for a total of 25 broadband subscribers per 100 inhabitants. In sharp contrast to the US, DSL makes up 60% of worldwide broadband subscribers, with cable making up 29%, fiber plus LAN 9%, and other methods making up 2% (see Figure 6).
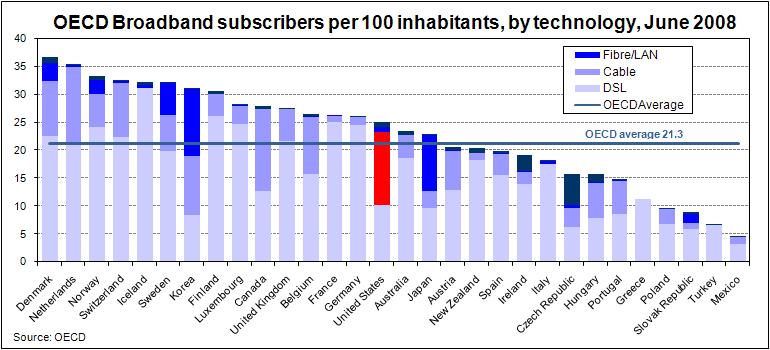
Figure 5: Worldwide Broadband Penetration by Country by Technology
Source: OECD
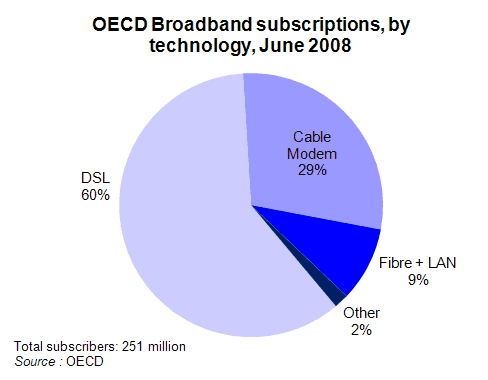
Figure 6: Worldwide Broadband Penetration by Technology
Source: OECD
Percentage of Fiber Connections in Total Broadband Subscriptions
Fiber has overtaken DSL and cable in Japan and Korea with 45% and 39% broadband subscribers on fiber respectively (see Figure 7). Sweden (19%), the Slovak Republic (18%), and Denmark (9%) follow in their percentage of broadband connections from fiber. The US remained at 3% of its broadband subscribers on optical fiber connections in June 2008, with no change from December 2007.
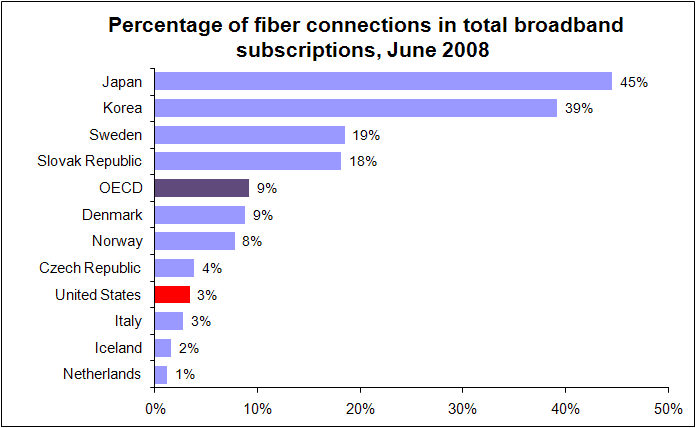
Figure 7: Percentage of fiber connections of total broadband subscriptions
Source: OECD
Historical Broadband Penetration Rates by Country
Figure 8 shows the overall broadband penetration rankings over the past seven years for OECD countries worldwide. Denmark (36.7), the Netherlands (35.5), Norway (33.4), Switzerland (32.7), and Iceland (32.3) lead all countries in broadband penetration per 100 inhabitants. Canada came in 10th at 27.9 broadband subscribers per 100 inhabitants, followed by the UK at 11th at 27.6, and the US came in 15th at 25% of the population on broadband.
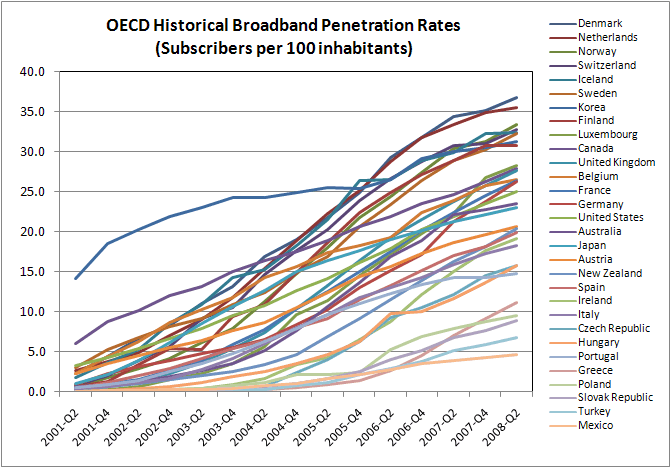
Figure 8: Historical broadband penetration rates by country
Source: OECD
Home Connectivity in the US
US broadband penetration grew to 91.8% in September 2008. Dial-up users connecting at 56Kbps or less now make up 8.2% of active Internet users,
down 0.26 percentage points from 8.46% in August 2008 (see Figure 9).
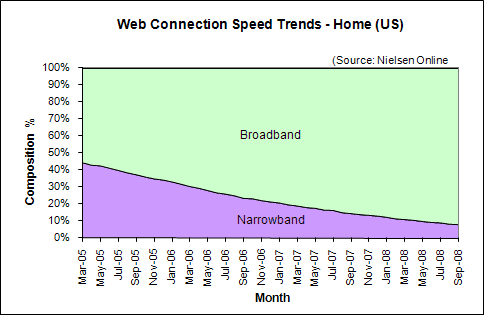
Figure 9: Web Connection Speed Trends – Home Users (US)
Source: Nielsen Online
Broadband Growth Trends in the US
In September 2008, broadband penetration among active Internet users in US homes grew by 0.26 percentage points to 91.8%, up from 91.54% in August. This increase of 0.26 points is half the average increase in broadband of 0.53 points per month over the last six months (see Figure 10).
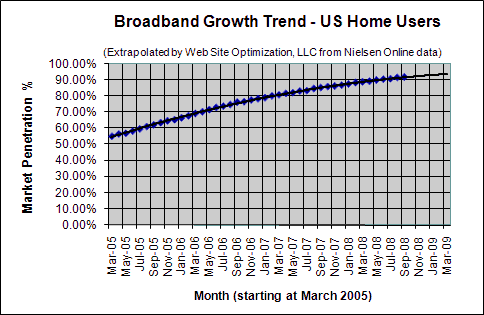
Figure 10. Broadband Adoption Growth Trend – Home Users (US)
Extrapolated from Nielsen Online data
Work Connectivity
As of September 2008, 96.66% of US workers connected to the Internet with broadband, down 0.15 percentage points from the 96.81% share in August. At work, 3.34% connect at 56Kbps or less (see Figure 11).
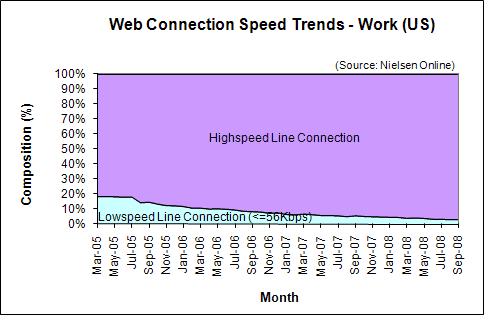
Figure 11: Web Connection Speed Trends – Work Users (US)
Source: Nielsen Online
Further Reading
- Nielsen Online
- Provided the US broadband penetration data for active Internet users for the Bandwidth Report.
- Organisation for Economic Co-operation and Development
- The OECD’s October 2008 report provided the data for this month’s bandwidth report (June 2008 survey).