
Japan has the highest percentage of fiber-optic subscribers to broadband in the world. Nearly 48% of broadband subscribers use fiber-optic connections in Japan, well above the OECD average of 10% worldwide. At its current growth rate, more than half of Japan’s broadband lines will be on fiber-optic networks by the summer of 2009. Meanwhile, US broadband penetration among active Internet users grew to 93.44% in April.
Japan Nears 50% Fiber-Optic Broadband Penetration
Since our last OECD broadband survey, Japan has grown 3 percentage points to nearly 48% fiber penetration among broadband subscribers, up from the 45% in June 2008. At this growth rate of 3 percentage points every 6 months, Japan should break 50% fiber penetration in the summer of 2009 (see Figure 1). Korea is coming on strong with a 4 point jump from 39% to over 43% from June 2008 to December 2008. Sweden and the Slovak Republic each grew about one percentage point in fiber penetration during the same time period. The United States ranked 8th (behind the Czech Republic at 4% fiber) in fiber-optic penetration among broadband subscribers at 3.8%, up less than 1 percentage point from 3% in June 2008.
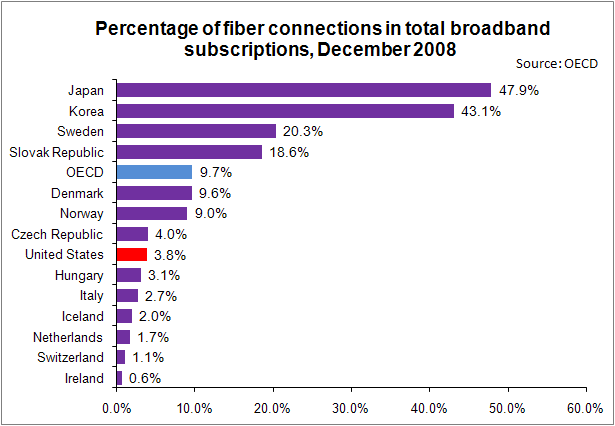
Figure 1: Percentage of fiber-optic connections in total broadband subscriptions – Dec. 2008
Source: OECD
Average Monthly Broadband Prices
Greece led all countries with the lowest average monthly broadband price of $30.06 (see Figure 2). Japan came in a close second at $30.46, followed by Finland at $30.61, the United Kingdom at $30.63, Italy at $31.25, and Switzerland at $32.71. The US came in near the middle of the pack at $45.52, about 50% more than the lowest cost countries, followed closely by Canada at $45.65. Australia ($56.21), Mexico ($59.52) and the Slovak Republic ($78.86) trailed the pack with the three highest monthly broadband subscription prices. What type of bandwidth do you get for these monthly broadband prices?
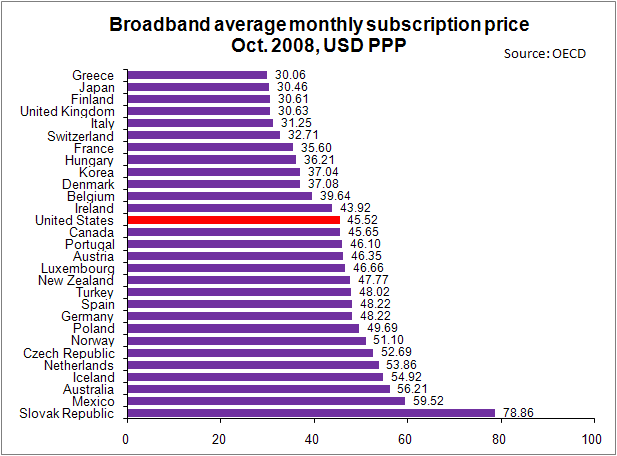
Figure 2: Average Monthly Price for Broadband – Oct. 2008
Source: OECD
Average Monthly Cost per Megabit per Second
While Korea continues to give broadband subscribers the most bang for their buck (only 85 cents per Mb/second), their average monthly subscription price is $7 higher than Greece and Japan. With its more developed high-speed broadband infrastructure, Japan continues to deliver a fast yet low-cost broadband experience to its subscribers with less than $5 per Mb/second throughput ($4.79). The price of bandwidth in the US is over twice that of Japan, at $10.02 per Mb/second of broadband. Note that while Canada and the US have nearly the same monthly subscription price of $45, the advertised throughput is over 2.5 times slower in Canada ($26.11 per Mb/second).
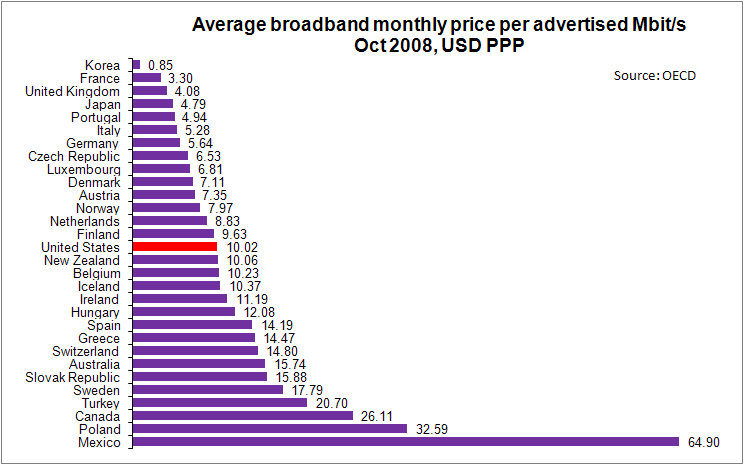
Figure 3: Average Monthly Broadband Price Per Advertised Mb/second – Oct. 2008
Source: OECD
Broadband Penetration versus GDP Per Capita
Broadband penetration appears to correlate well (0.66) with GDP per capita. Denmark (37.2% penetration), the Netherlands (35.8%), and Norway (34.5%) top the list while the US remains in 15th place at 26.7% penetration (see Figure 4).
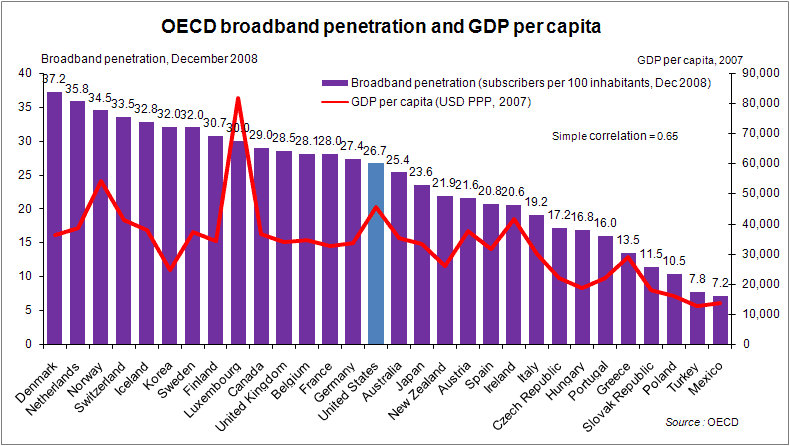
Figure 4: Broadband Penetration versus GDP per capita – December 2008
Source: OECD
Broadband Penetration by Technology
The composition of broadband connections in the OECD countries surveyed is shown in Figure 5. Japan, Korea and Sweden have a larger proportion of their subsribers on fiber connections. The US and Canada have a large proportion of cable subscribers, while in higher ranking countries DSL appears to dominate the broadband mix.
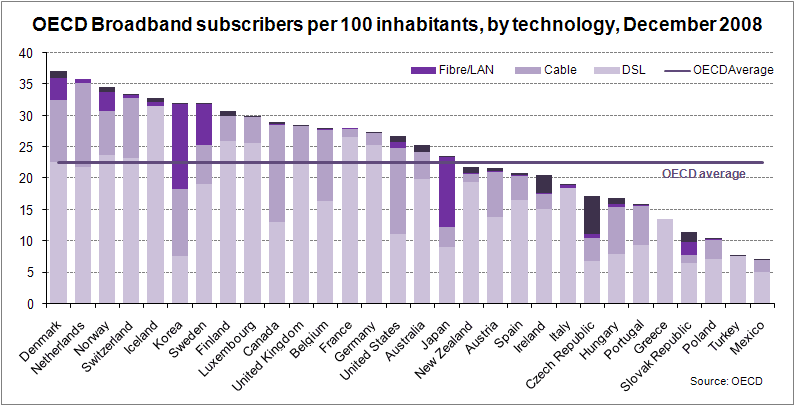
Figure 5: Broadband Subscribers per 100 Inhabitants, by technology – December 2008
Source: OECD
Home Connectivity in the US
US broadband penetration grew to 93.44% in April 2009. Dial-up users connecting at 56Kbps or less now make up 6.56% of active Internet users (see Figure 4).
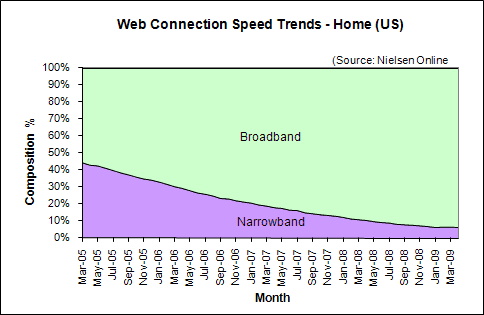
Figure 4: Web Connection Speed Trends – Home Users (US)
Source: Nielsen Online
Broadband Growth Trends in the US
In April 2009, broadband penetration among active Internet users in US homes grew to 93.44%, up 0.31 percentage points from the 93.13% March 2009 (see Figure 7).
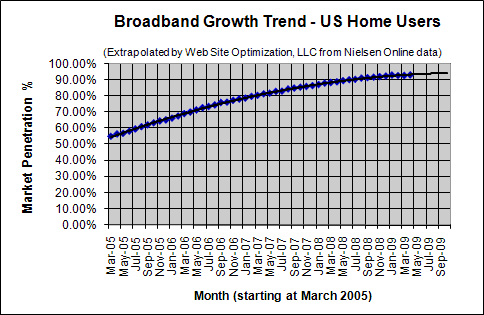
Figure 7. Broadband Adoption Growth Trend – Home Users (US)
Extrapolated from Nielsen Online data
Work Connectivity
As of April 2009, 97.15% of US workers connected to the Internet with broadband, down 0.04 percentage points from the 97.19% share in March. At work, 2.85% connect at 56Kbps or less (see Figure 8).
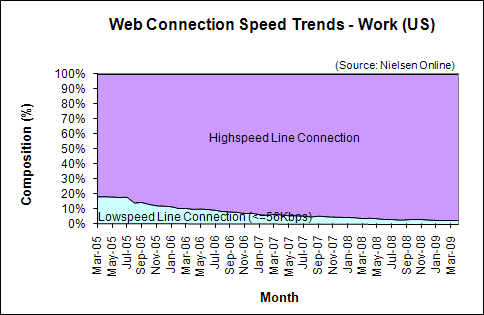
Figure 8: Web Connection Speed Trends – Work Users (US)
Source: Nielsen Online
Further Reading
- Nielsen Online
- Provided the US broadband penetration data for active Internet users for the Bandwidth Report.
- Organisation for Economic Co-operation and Development
- Provided the worldwide broadband data for the Bandwidth Report.