
As part of the National Broadband Plan the FCC was tasked with providing more transparency in broadband information for consumers. Their latest Measuring Broadband America report tests large ISP claims of advertised speeds versus actual speeds, latency, and web page download times. This article summarizes the report and gives major findings related to web performance including:
- The ratio between actual versus advertised speeds has improved from 87% in 2011 to 96% in 2012
- Increasing bandwidth above 10Mbps has little effect on web page load time
- Some ISPs fared better than others, Comcast versus Frontier for example
We’ll explore latency and web page load times at different bandwidths in part II of this report.
FCC’s Measuring Broadband America Study
The FCC July 2012 study is the second since the August 2011 study of the Measuring Broadband America Project. The FCC chose SamKnows.com to conduct the measurements for their July 2012 study. The study tested service offerings from 13 of the largest broadband providers in the USA, 12 which collectively account for over 80 percent of all U.S. wireline broadband connections. The objective of the Measuring Broadband America study is to measure broadband service performance as delivered by an ISP to the home of a consumer.
Actual versus Advertised Broadband Performance
The FCC compared the advertised download and upload speeds of 13 of the largest ISPs (see Figure 1). ISPs fared better in 2012 with a 96% ratio between actual and advertised speeds, up from 87% in 2011. Comcast, Cablevision, Mediacom, and Verizon Fiber tested at 100% or more for both download and upload speeds.
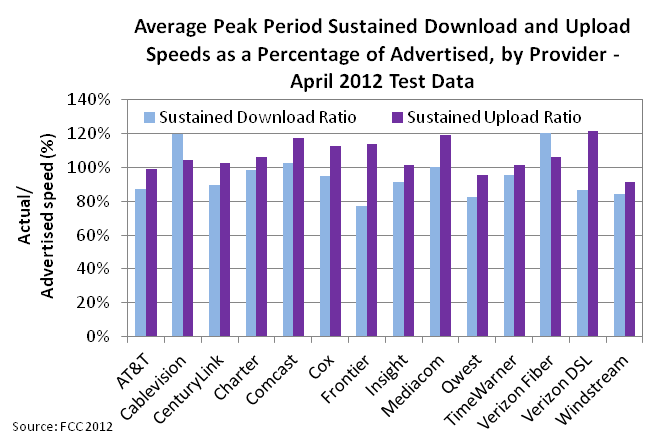
Figure 1: Average Peak Period Sustained Download and Upload Speeds as a Percentage of Advertised Speed, by Provider -July 2012
Source: FCC
Actual versus Advertised Speeds, 1-3Mbps
The FCC report goes on to measure the ratio of actual versus advertised speeds at various bandwidth speeds. Figure 2 shows the providers tested at the “slower” 1-3 Mbps range.
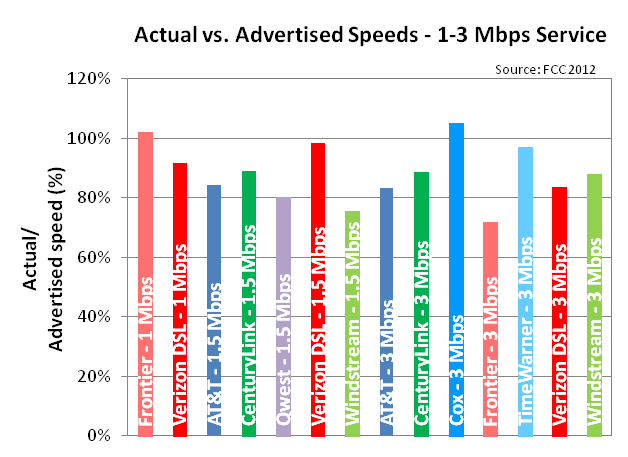
Figure 2: Actual vs. Advertised Speeds, 1-3 Mbps – July 2012
Source: FCC
Actual versus Advertised Speeds, 6-10 Mbps
Moving up to the 6-10 Mbps speed range, only Comcast exceeded 100% among the providers tested (see Figure 3).
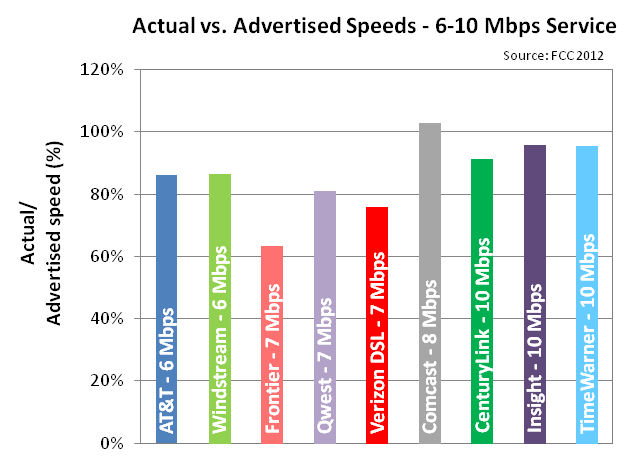
Figure 3: Actual vs. Advertised Speeds, 6-10 Mbps – July 2012
Source: FCC
Actual versus Advertised Speeds, 12-15 Mbps
Moving higher to the 12-15Mbps speed range, six of the providers tested exceed 100% (see Figure 4). Note that there are more results at higher speeds in the full report, but we stop at this speed because speeds about 12-15 Mbps showed little or no improvement to web page load times. We’ll continue this summary in part II of this report.
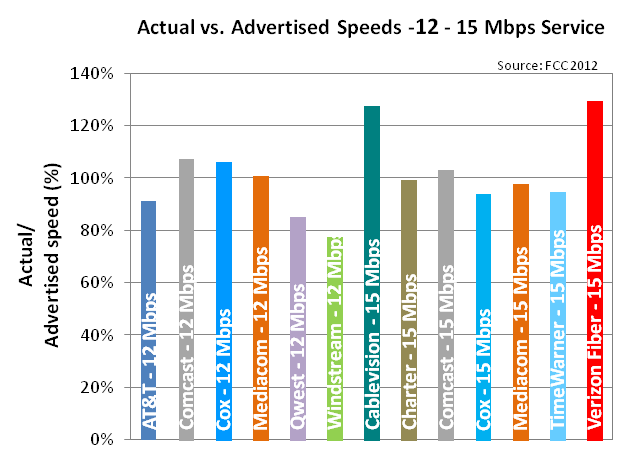
Figure 4: Actual vs. Advertised Speeds, 12-15Mbps – July 2012
Source: FCC
Conclusion
Although the gap between advertised and actual broadband speeds is closing among US ISPs, there is still a 25-33 percentage point difference between the fastest and slowest providers at identical speed tiers, We’ll explore the effects of latency and bandwidth on web page load times in part II of this report.
Further Reading
- Measuring Broadband America – July 2012
- Second FCC survey on measuring broadband performance from large ISPs
- SamKnows.com
- Analytics firm chosen by the FCC (and the UK) to conduct the broadband study summarized here.