
As part of the National Broadband Plan the FCC was tasked with providing more transparency in broadband information for consumers. In Part II of our Measuring Broadband America summary, the FCC tested web site performance measures versus broadband provider. They found that latency varies with broadband type (DSL, Cable, and Fiber), and that average web page download times changed little above 10-12 Mbps. Part I of this report showed the broadband performance of 13 different ISPs at different bandwidths.
Average Latency versus Advertised Speed – 2012
Latency is the time it takes for a TCP packet of data to travel from one hop to another in a network, normally expressed in milliseconds (ms). Latency can be a major factor in web page download speed, especially at higher bandwidths. In the tests shown below, latency is defined as the round-trip time from the consumer’s home to the closest server used for the speed measurement within the provider’s network (see Figure 1). Latency averaged 31 milliseconds in 2012 across all technologies, down slightly from 33 ms in 2011.
During peak periods latency increased by 6.5 percent in 2012, compared to 8.7% in 2011. Fiber services averaged 18ms round-trip latency, while cable-based services averaged 26 ms, and DLS-based services averaged 43 ms. This compares to 2011 figures of 17 ms for fiber, 28 ms for cable and 44 ms for DSL. Figure 1 shows the average latency versus advertised speeds.
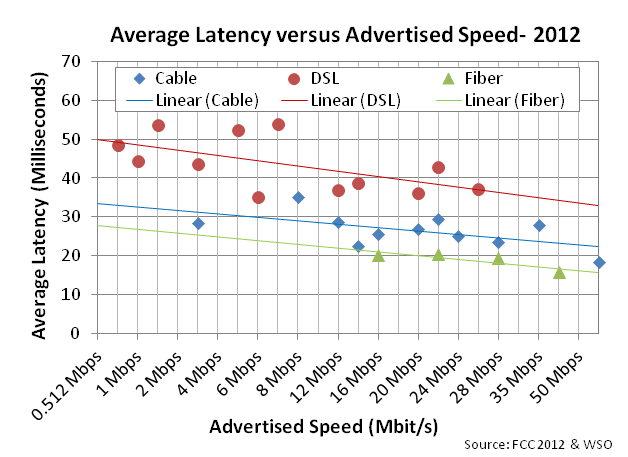
Figure 1: Average Latency vs. Advertised Speed – July 2012
Source: FCC
Average Web Page Download Time
The researchers then tested the average time it took to download a typical web page over various bandwidth speeds.
In general, the time it takes to load a web page decreased as bandwidth speeds increase, but only up to about 10Mbps. Latency and object overhead limit response time starting at around 10Mbps and higher. For higher speed tiers of broadband, consumers are unlikely to see much if any improvement in web page load time and basic web browsing speed, say when moving from a 10 Mbps connection to 25 Mbps. Note that this assumes a single user per connection, households with many consumers connected simultaneously would benefit from increased bandwidth, and loading streaming videos and other multimedia would benefit from higher bandwidths.
Charts 2-6 show the average web page load time for various bandwidths. As you’d expect, web page load time decreases as bandwidth increases, but only up to about 10Mbps. Web page load times are limited by intrinsic factors such as service architectures, latency, object overhead, and protocol effects and not easily improved at the current time.
Average Web Page Load Time from 1-3 Mbps
Figure 2 shows the average web page load time for the “slower” 1-3 Mbps speeds. Download times averaged 6.28 seconds for 1 Mbps connections, and 5.3 seconds for 1.5 Mbps connections. Web page load times dropped to 3.05 seconds on average for 3 Mbps connections. So load times can be reduced by more than 51% by moving from a 1 to 3 Mbps connection.
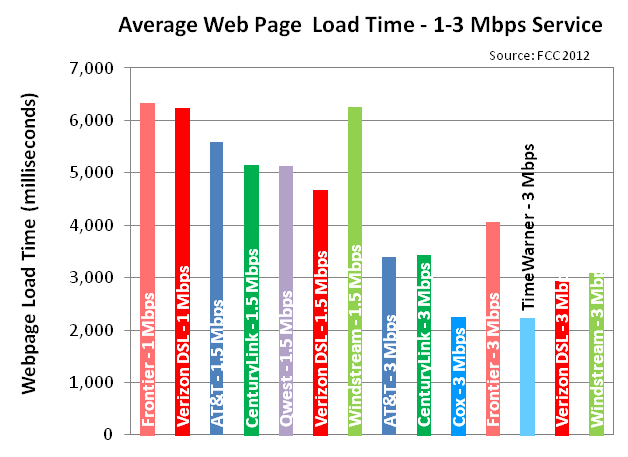
Figure 2: Average Web Page Load time, 1-3Mbps
Source: FCC
Average Web Page Load Time from 6-10 Mbps
Moving up to the 6-10 Mbps tier, web page load times drop to 2 seconds at 6 Mbps on average (see Figure 3), to 1.5 seconds at 10 Mbps. Comcast at 8 Mbps actually loaded web pages faster than 10 Mbps connections (1.29 seconds versus 1.5 seconds for 10 Mbps). So you save 4.3 seconds (a 68% drop) to 1.5 seconds (50.8% drop) in load time moving from 1 to 6 Mbps or 3 to 10 Mbps connections respectively.
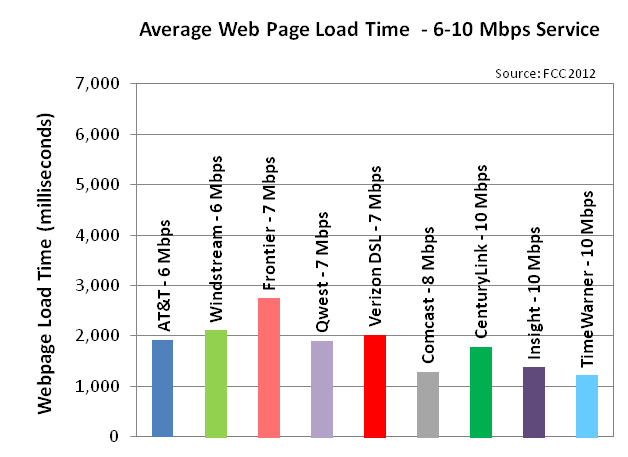
Figure 3: Average Web Page Load time, 6-10Mbps
Source: FCC
Average Web Page Load Time from 12-15 Mbps
Moving up to 12 Mbps web page load time averaged 1.42 seconds, some 29% faster than a 6 Mbps connection (see Figure 4). At 15 Mbps the non-fiber providers averaged 1.16 seconds to load a web page, some 22.7% faster than a 10 Mbps connection. So as bandwidth speeds move from 10 to 15 Mbps you get diminishing returns in proportion to the increase in bandwidth, i.e., a 50% increase in bandwidth yields a 22.7% faster web page load time.
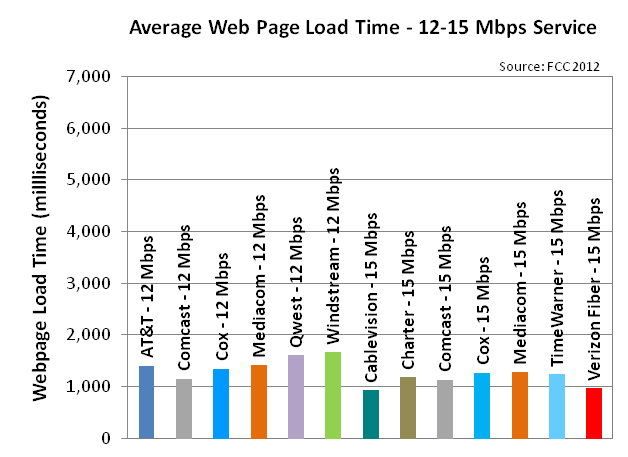
Figure 4: Average Web Page Load time, 12-15 Mbps
Source: FCC
Average Web Page Load Time from 18-25 Mbps
At 18-25 Mbps, web page load times increase even less. Moving from 12 Mbps to 18 Mbps speeds up web page load time from 1.42 to 1.3 seconds, or 8.4% faster (see Figure 5). Moving from 15 Mbps to 25 Mbps speeds up web page load times from 1.16 seconds to 1.1 seconds, or 5.1% faster. Note that the fiber version of 25 Mbps was excluded from the above average, and was 0.92 seconds to load the typical web page. Fiber has lower latency and faster load times at equivalent speeds to cable.
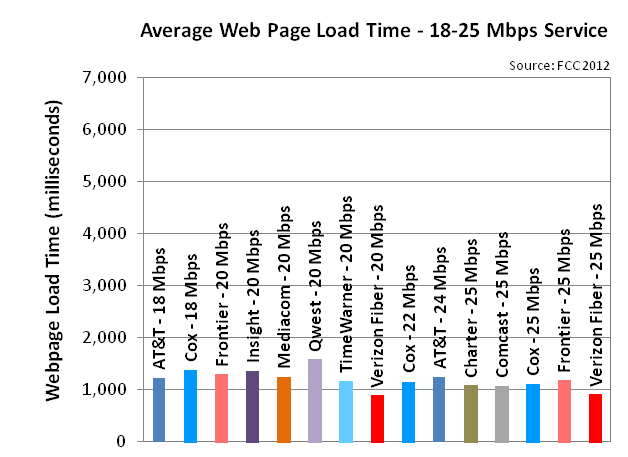
Figure 5: Average Web Page Load time, 18-25 Mbps
Source: FCC
Average Web Page Load Time from 30-50 Mbps
Finally at the fastest speeds tested, moving to 30 Mbps drops the load time to 1.07 seconds, or 17.7% faster.
Moving from 25 Mbps to 50 Mbps drops the load time from 1.1 seconds to 0.86 seconds or 21.8% faster (see Figure 6).
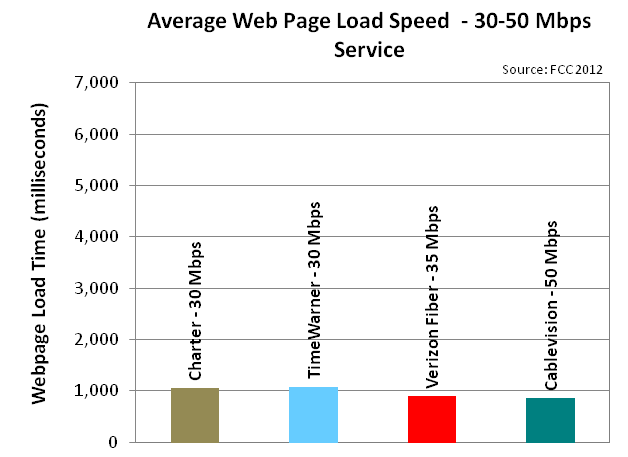
Figure 6: Average Web Page Load time, 30-50 Mbps
Source: FCC
Hourly Sustained Download Speeds by Broadband Provider
The FCC then tested the hourly download speed as a percentage of advertised speed by broadband provider. Of the cable providers, Comcast showed the highest and most stable download speeds (see Figure 7).
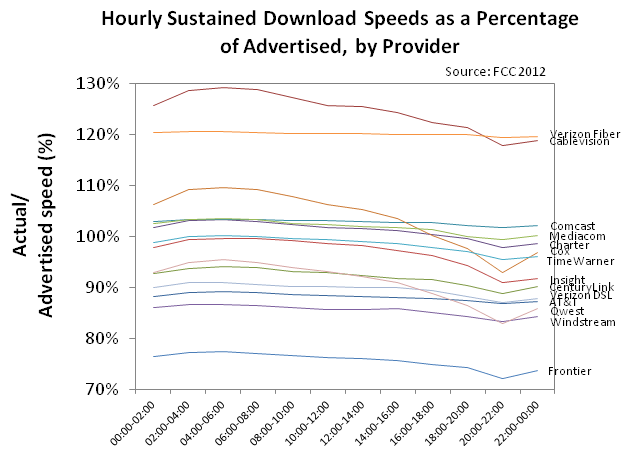
Figure 7: Hourly Sustained Download Speeds as a Percentage of Advertised, by Provider
Source: FCC
User Upgrades to Higher Broadband Speed Tiers
So despite the fact that above about 10 Mbps, users see little improvement in web page browsing speed, more people are upgrading from the mid-range tiers than other speeds (73% from 7-10 Mbps and 64% from 10-15 Mbps, see Figure 8).
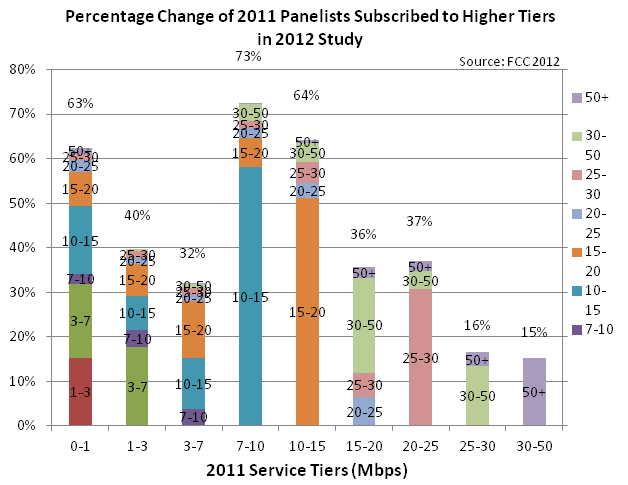
Figure 8: Percentage Change 0f 2011 Panelists Subscribed to Higher Tiers in 2012
Source: FCC
Conclusion
In terms of web performance, the most effective upgrade consumers can make is moving from 1-3 Mbps to 6-10 Mbps broadband. Above 10-12 Mbps, web page load times don’t increase in proportion to broadband speeds. Despite the fact that speeds above 10-12 Mbps have little effect on web page browsing speeds, more people are upgrading from the mid-range tiers than other speeds.
Further Reading
- Measuring Broadband America – July 2012
- Second FCC survey on measuring broadband performance from large ISPs
- Optimize Parallel Downloads to Minimize Object Overhead
- With the average web page growing past 50 external objects, object overhead now dominates most web page delays. Increasing parallel downloads by using multiple hostnames can realize up to a 40% improvement in web page latency.