
The size of the average web page of the top 1000 websites passed 1600K for the first time in July (see Figure 1). At the same time the number of objects in the average web page increased to 112 objects in July 2014.
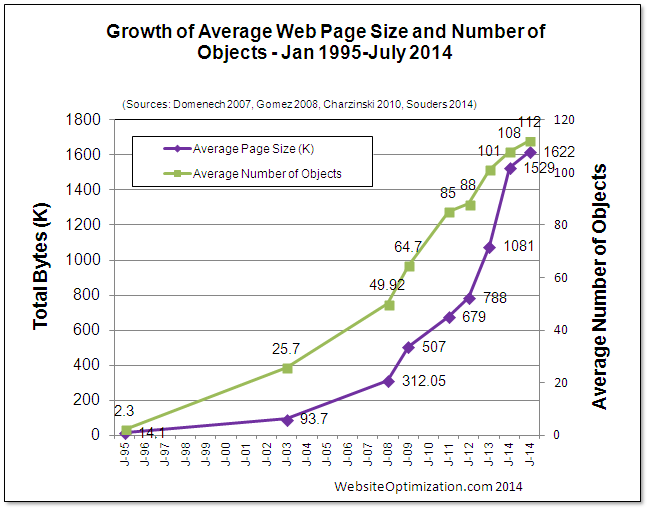
Figure 1: Growth of the Average Web Page
Average Web Page versus Survey Size
In the HTTParchive.org site, the data also revealed that the average web page for the top 300,000 pages is 1829K in size made of up 96 objects on average. So the top 1000 pages have more objects (112 vs. 96) but less K (1622K vs. 1829K). The top 100 web pages average 1612K with 90 requests per page (see Figure 2). So page size appears to be inversely related to site traffic. The more traffic a site has, the smaller the pages. For the average number of web objects the correlation holds true for the top 100 and 1000 pages, but not the top 300,000.
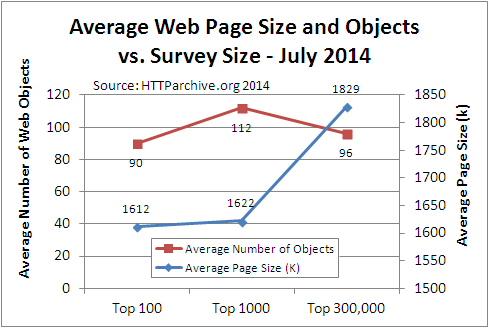
Figure 2: Average Web Page Size and Objects vs. Survey Size
The Effects of Caching and other relevant statistics
Charzinski’s 2010 paper shows the beneficial effects of caching on performance. Table 1 shows that the average top 500 home page goes from 507K and 64.7 requests upon initial cache-cleared load to 98.5K and 16.1 requests. One average, caching on these popular sites saves 81 percent of the bytes, and 75 percent of the requests.
Other data from the study showed that Akamai still dominates CDNs, with 43.6 percent of the top 500 using Akamai, delivering 22.3% of the initial load, and 25.8 percent of the cached loads overall. Limelight, Footprint, Panther Express and Google round out the top five CDNs. 167 (33.4%) of the top 500 sites employed one or more of the Web 2.0 technologies (XHR, JSON, or GWT Google Web Toolkit).. 38 percent employed from 1-10 web bugs on their home pages.
| Load State | Hosts | Connections | Bytes Received | Elements Retrieved |
|---|---|---|---|---|
| S1 Ave. | 7.6 | 25.2 | 507K | 64.7 |
| S1 Max | 38 | 172 | 6.9M | 31.4 |
| S2 Ave | 5.5 | 10.9 | 98.5K | 16.1 |
| S2 Max | 27 | 82 | 3.5M | 162 |
Further Reading
- Acharya, S., and B. Smith, “An Experiment to Characterize Videos Stored On the Web,”
- in MMCN 1998 (San Jose, CA: Jan. 1998), 166-178.
- Berkowitz, D., and A. Gonzalez, “Andy: Keynote data for your use,”
- e-mail to author (Feb. 8, 2008). Keynote Systems, Inc. provided the graph of the KB40 response time from Feb. 2006 to Feb. 2008. The average web page load time for the KB40 decreased from 2.8 to 2.33 seconds from Feb. 2006 to Feb. 2008.
- Cha, M., Kwak, H., Rodriguez, P., Ahn, Y.-Y., and S. Moon, “I Tube, You Tube, Everybody Tubes: Analyzing the World’s Largest User Generated Content Video System,”
- in IMC 2007 (San Diego, CA: October 24-26, 2007), 1-13. YouTube is estimated to carry over 60% of videos online, serving 100 million videos daily. Simple caching of the most popular videos offloaded server traffic by as much as 50%.
- Charzinski, J. “Traffic Properties, Client Side Cachability
and CDN Usage of Popular Web Sites” - B. M¨uller-Clostermann et al. (Eds.): MMB & DFT 2010, LNCS 5987, pp. 136-150, 2010.
Springer-Verlag Berlin Heidelberg 2010 - Domenech, J., Pont, A., Sahuquillo, J., and J. Gil, “A user-focused evaluation of web prefetching algorithms,”
- Computer Communications 30, no. 10 (2007): 2213-2224. In 1995 there were 2.3 average objects per page and 25.7 in 2003 (average of two traces).
- Flinn, D., and B. Betcher of Gomez.com, “Re: latest top 1000 website data?”
- e-mail to author, Jan. 8, 2008. As of January 2008, the average top 1000 home page was 312K in total file size, referencing 49.92 total objects.
- Flinn, D., and B. Betcher, “Re: mockup of section in book about slower pages vs higher,”
- e-mail to author, Nov. 16, 2007. Gomez surveyed for the author the top 50 retailers for response times, consistency, and composition.
- Gill, P., Arlitt, M., Li., Z., and A. Mahanti, “YouTube Traffic Characterization: A View From the Edge,”
- in IMC 2007 (San Diego, California: October 24-26, 2007), 20. About 24% of videos are interrupted because of poor performance or poor content quality.
- Gonzalez-Cañete, F., Casilari, E., and A. Triviño-Cabrera, “Characterizing Document Types to Evaluate Web Cache Replacement Policies,”
- in ECUMN 2007 (Toulouse, France: Feb. 14-16, 2007), 3-11.
- Guo, L., Chen, S., Xiao, Z., and X. Zhang, “Analysis of Multimedia Workloads with Implications for Internet Streaming,”
- in WWW 2005 (Chiba, Japan: May 10-14, 2005), 519-528.
- King, A., “CSS Sprites: How Yahoo.com and AOL.com Improve Web Performance,”
- Learn how AOL and Yahoo! use CSS sprites to improve performance for their busy home pages. CSS sprites save HTTP requests by using CSS positioning to selectively display composite background images. To maximize accessibility and usability, CSS sprites are best used for icons or decorative effects. Website Optimization, Sep. 26, 2007.
- King, A., “HTTP Compression,”
- HTTP compression uses standards-based gzip and deflate compression algorithms to compress your XHTML, CSS, and JavaScript to speed up web page downloads and save bandwidth. Website Optimization, Dec. 4, 2003.
- King, A., “Minimize HTTP Requests,”
- By combining external files and embedding CSS and JavaScript within your HTML you can minimize the number of HTTP requests required to render your page. Each unique HTTP request requires a round trip to a server, introducing indeterminate delays. Website Optimization, Dec. 17, 2003.
- King, A., “Optimize Parallel Downloads to Minimize Object Overhead,”
- With the average web page growing past 50 external objects, object overhead now dominates most web page delays. Increasing parallel downloads by using multiple hostnames can realize up to a 40% improvement in web page latency. Website Optimization, Dec. 26, 2007.
- King, A., “Suture CSS or JavaScript Files to Reduce HTTP Requests,”
- Learn how to “suture” CSS or JavaScript files together before delivery from the server to save HTTP requests. You’ll have your organization and eat it too with this server-side approach to merging files. Website Optimization, Oct. 31, 2007.
- King, A., “The Average Web Page – Preliminary Results,”
- Preliminary results from a 2006 web page survey run for the author by Ryan Levering. OptimizationWeek.com, Oct. 26, 2006.
- King, A., “Use Server Cache Control to Improve Performance,”
- Configure your Apache server for more efficient caching to save bandwidth and improve web site performance. A web cache reduces latency and improves web site response times. Website Optimization, Oct. 23, 2004.
- Levering, R., “RE: revised web page survey,”
- e-mail to author (July 27, 2007). In a random survey of 500 pages indexed by Google for the author, 62.6% of pages used the TABLE tag while 85.1% used the DIV tag. Tables nested to an average maximum depth of 1.47, with an average number of 12.57 table tags per page. The average maximum HTML depth was 15.35, demonstrating how DIVs are replacing table nesting.
- Levering, R., and M. Cutler, “The Portrait of a Common HTML Web Page,”
- in DocEng 2006 (Amsterdam, The Netherlands: October 10-13, 2006), 198-204. Found that the average web page contained 474 words, 281 HTML tags, and 41 links, 10 of which pointed outside the domain. Also found that the average web page was 1440 pixels in height. Table nesting depth was 2.95.
- Li, M., Claypool, M., Kinicki, R., and J. Nichols, “Characteristics of Streaming Media Stored on the Web,”
- ACM Transactions on Internet Technology 5, no. 4 (2005): 601-626.
- Ramachandran, S. 2010, May 26, “Web metrics: size and number of resources,”
- Using the Googlebot, Sreeram analyzed both 380 million top sites and 4.2 billion websites to see what the average web page consists of. He found that the average web page is 320K in size, using 43.91 resources per page.Just 66% of compressible bytes were compressed using HTTP compression in the entire Web. 64.3% of the average web page was taken up by images (205.99K of images divided by 320K size of average web page). There were 7 scripts and 3.2 external style sheets. The uncompressed size of the top sites was 477.2K, while the uncompressed size of the average web page (4.2 billion) was 376.7K. Interestingly, the top sites network size (bytes delivered down the pipe) was smaller (312K vs. 320) than the overall average web page, due in part to the increased used of HTTP compression (89% versus 66%). Google, May 26, 2010.
- Sounders, S. “The HTTP Archive“
- This useful site tracks statistics about how the web was built, including size, page composition, PageSpeed results, and more. Data taken from the Nov. 2012 test run.
- Yuan, J.-L., Li, X., and C.-H. Chi, “Understanding the Impact of Compression on Web Retrieval Performance,”
- in AusWeb05 (Royal Pines Resort, Australia: July 2-6, 2005), http://ausweb.scu.edu.au/aw05/papers/refereed/yuan/paper.html (Feb. 10, 2008).
All,
Comments should now work, they were inadvertently turned off after our upgrade to MT 4.X.
I’ve added a section on the reasons why the average web page has grown in size and complexity per reader request.
Great info, but I was confused re: “At the time of this writing, however, 43% of US households are still on dial-up, according to our latest bandwidth report.”
When I read the stats at https://www.websiteoptimization.com/bw/0804/ I didn’t get that 43% of US households are still on dial-up…I read it as in ALL US households, broadband penetration was at 57% and then in households that actually have an internet connection, 88% were using broadband (meaning less than 12% of homes w/ an internet connection were using dialup). So of that 43% not on broadband, some are on dialup and some have NO internet connection.
Can you clarify which it really is? 43% of US households still being on dialup seems high in comparison to what I’ve read elsewhere.
Very interesting and detailed post. I included it in my International Marketer Review Blog Carnival that was posted today.
I look forward to reading your new book.
Can you show an example of what progressive enhancement looks like? Is there a site out there doing this now? The only way I can think to know if users are using dial-up or broadband is include additional scripting to measure the speed of their downloads, adding to the already burgeoning load. As well some functionality just can not be replicated with less which defeats the purpose of some web content/applications. Certainly there is a lot of gratuitous media and graphics, but in increasing number of cases that is the content.
I think most folks who do use dial-up at home (I also echo the question of Megan on the validity of 43% on dial-up), probably do so because of the lack of broadband availability not because of choice or limited income. So an alternative solution is to kick the butts of providers to get that access. The US is falling behind other countries in speed of connectivity.
Jim,
You asked for an example of progressive enhancement (PE). We wrote about PE in my new book Website Optimization Secrets on pp. 283-288 and give a couple of examples. One of which is from contributor Dave Artz at
Artz Studio where Artz shows a tab box example that uses progressive enhancement. The WikiPedia listing for same cites Dave as inventing this technique.
Hope this helps.
Andrew,
You did not address Cindy’s question above.
In any case, other data available from the Pew Internet & American Life Project supports her position, actually showing U.S. dial-up home-users at 10%.
You may consider revisiting that in your article above.