
Many sites now use Google Analytics to track their metrics. Google Analytics gives some useful statistics not normally found from server-side log files, including PPC versus natural SEO traffic and visitor behavior. Used as directed however, Google Analytics can slow down your pages. This article shows how improve the speed of web pages using Google Analytics with a few simple changes, while maintaining its advantages for faster-loading sites.
Placement of Google Analytics’ JavaScript
After you signup for Google Analytics (http://www.google.com/analytics/) Google gives you a snippet of JavaScript to include in your web pages. This snippet contains a unique code (see _setAccount below) identifying your website, as well as a link to the “ga.js” JavaScript file (google-analytics.com/ga.js) that is called to grab the data. The code for WebsiteOptimization.com looks like this:
<script type="text/javascript">
var _gaq = _gaq || [];
_gaq.push(['_setAccount', 'UA-21014437-1']);
_gaq.push(['_trackPageview']);
(function() {
var ga = document.createElement('script'); ga.type = 'text/javascript'; ga.async = true;
ga.src = ('https:' == document.location.protocol ? 'https://ssl' : 'http://www') + '.google-analytics.com/ga.js';
var s = document.getElementsByTagName('script')[0]; s.parentNode.insertBefore(ga, s);
})();
</script>
</head>
Google instructs webmasters to place this code just before the closing </head> tag, at the end of the HEAD element in their XHTML files. The code is purported to be asynchonous, meaning it should load the script after the content has loaded. Let’s see what actually happens with a waterfall graph (courtesy of WebPageTest.org, see Figure 1).
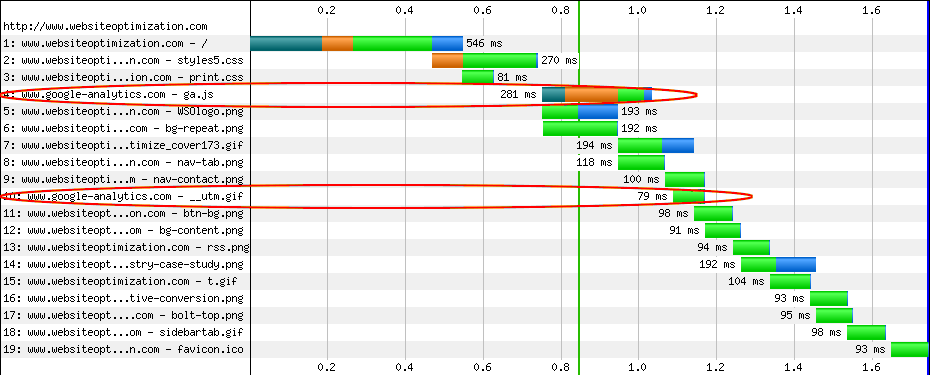
Figure 1: Waterfall Graph of WebsiteOptimization.com Google Analytics in HEAD
Note that the dark blue, orange, green and light blue colors signify DNS lookup, Initial Connection, Time to First Byte, and Content Download times respectively.
You can see that the external Google-Analytics.com/ga.js file loads fourth (4) in the sequence of 19 total files, while the 1 pixel GIF from Google loads tenth (10). The DNS lookup (58ms) and initial connection (137ms, in dark blue and orange respectively) times for the external ga.js file total 195 ms. You pay a price for loading files from another server due to DNS lookup time. Under load we noticed a slight delay after adding the Google code to the page.
The overall loading statistics are shown in Figure 2. Start render is shown as 0.844 seconds for the HEAD configuration.
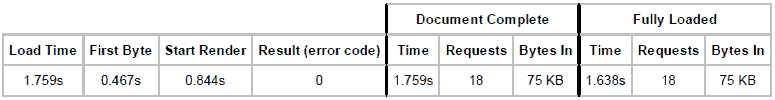
Figure 2: Loading Times for WebsiteOptimization.com with Google Analytics in HEAD
Let’s see what happens when we move the code to the footer.
Move JavaScript to the Bottom
As an experiment we moved the Google Analytics JavaScript snippet to the bottom of the page, just before the closing BODY element thus:
<script type="text/javascript">
var _gaq = _gaq || [];
_gaq.push(['_setAccount', 'UA-21014437-1']);
_gaq.push(['_trackPageview']);
(function() {
var ga = document.createElement('script'); ga.type = 'text/javascript'; ga.async = true;
ga.src = ('https:' == document.location.protocol ? 'https://ssl' : 'http://www') + '.google-analytics.com/ga.js';
var s = document.getElementsByTagName('script')[0]; s.parentNode.insertBefore(ga, s);
})();
</script>
</body>
The resulting waterfall graph looked like this (see Figure 3):
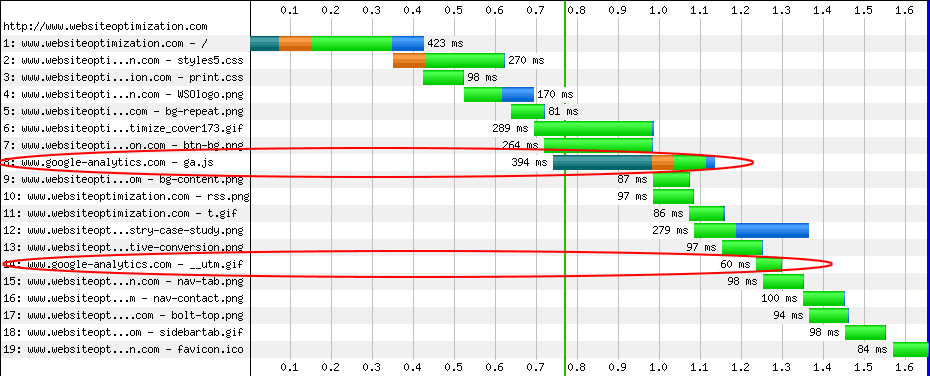
Figure 3: Waterfall Graph of WebsiteOptimization.com with Google Analytics before closing BODY
The Google Analytics JavaScript file moved from loading fourth (4) to eighth (8) in the sequence. This lets more useful content display for the user, giving them a sense of faster feedback from the page. In this case the DNS lookup was higher at 242ms, and the initial connection time was 55ms, for a total delay of 297ms or about 1/3 of a second on a high speed connection. The start render went from 0.84 to 0.77 seconds moving the JavaScript from the HEAD to the footer (your times may vary with each load See Figure 4).
The overall loading statistics for the code in the footer configuration are shown in Figure 4. Start render is shown as 0.768 seconds for the FOOTER configuration.
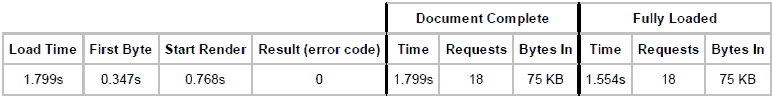
Figure 4: Loading Times for WebsiteOptimization.com with Google Analytics in FOOTER
Localize External JavaScripts
To avoid the extra overhead of off-server resources (DNS lookup and Time to First Byte) you can localize your JavaScripts on your server. We copied the ga.js file from google-analytics.com/ga.js and placed it at websiteoptimization.com/ga.js, and changed the code accordingly (google-analytics.com/ga.js to websiteoptimization.com/ga.js):
<script type="text/javascript">
var _gaq = _gaq || [];
_gaq.push(['_setAccount', 'UA-21014437-1']);
_gaq.push(['_trackPageview']);
(function() {
var ga = document.createElement('script'); ga.type = 'text/javascript'; ga.async = true;
ga.src = ('https:' == document.location.protocol ? 'https://ssl' : 'http://www') + '.websiteoptimization.com/ga.js';
var s = document.getElementsByTagName('script')[0]; s.parentNode.insertBefore(ga, s);
})();
</script>
</body>
Let’s see what happens to the waterfall graph after localizing this file (see Figure 5).
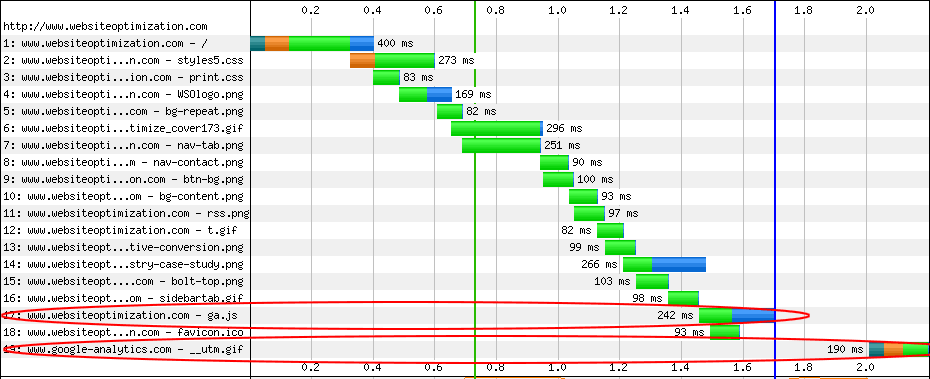
Figure 5: Waterfall Graph of WebsiteOptimization.com with Google Analytics before closing BODY local
The Google Analytics file now loads 17th, after all the page content displays. The start render time (green vertical line) moved from 0.77 seconds to 0.73 seconds or 13% faster than the initial start render time of 0.84 seconds (see Figure 6). There is now no DNS or Initial Connection overhead for the JavaScript file because it is stored locally.
The overall loading statistics for the code in the footer configuration are shown in Figure 6. Start render is shown as 0.73 seconds for the FOOTER local file configuration.
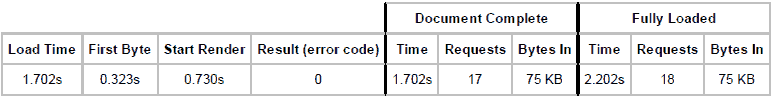
Figure 6: Loading Times for WebsiteOptimization.com with Google Analytics in FOOTER local
Cautions to This Method
There are a couple of cautions to watch out for with this method. Google periodically updates their analytics code to add more features. You can address this with a CRON script to periodically copy over the latest ga.js file, or copy the file manually periodically. The other caution is that Google says if you place the code at the end, you may lose some visitor data for people that don’t wait for the entire page to load. For faster pages this isn’t much of an issue, but for slower ones you may lose some visitor data this way. For us, the slight chance of a loss of some visitor data is more than offset in the gain in display speed.
Conclusion
You can speed up sites using Google Analytics with two simple changes. Move your analytics code to the bottom, and localize the JavaScript file. This article showed the effect of these changes on a real-world example with waterfall graphs.
Further Reading
- Google Analytics
- Google’s free analytics service uses JavaScript to gather data. Formerly the Urchin statistical software acquired, improved, and made into a free web service by Google.
- JavaScript Optimiation Tips
- Tips from WebsiteOptimization.com’s Speed Tweak.