
Over the past few years, ecommerce sites have made a concerted effort to improve their shopping experience. Most ecommerce sites employ third party gizmos to add features like chat, recommendations, reviews, personalization and localization. The problem is, these third party scripts extract a cost: inconsistent website performance.
The Growth of Third Party Services
With the big brand marketing departments demanding more dynamic Web 2.0 and 3.0 interactivity in their websites, web development departments have been scrambling to add sticky services to boost conversion rates and lower bounce rates. It is much easier to leverage existing mature services by inserting a couple lines of JavaScript than to roll their own services. Consequently the use of third party services has exploded, growing by 5.6 times in the 4 years from 2015 to 2018 (see Figure 1).
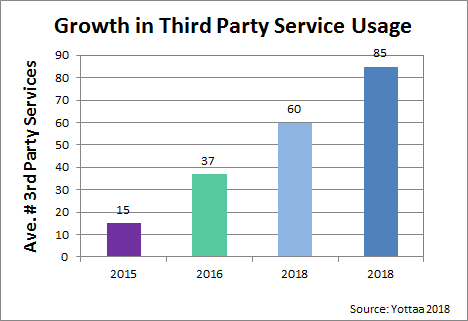
Figure 1: Growth of Third Party Service Usage
What Are Third Party Scripts?
Third party services are usually cloud-based technology deployed on ecommerce websites to improve the shopping experience. Typically inserted as lines of JavaScript loaded that transfer data to and from the 3rd party vendor’s servers and shopper’s browser. Popular third party services are analytics, advertising, tracking cookies, tag management, CDNs, reviews, recommendations, social networking and programming APIs.
How Third Party Scripts Slow Performance
When shoppers visit an ecommerce website, their browser starts to read and execute HTML. The browser will pause when it encounters a third party script, loading data from multiple databases, loading other hidden third, fourth or sixth party servers and services, off-site CSS and XML files, updating content in the browser, and sending shopper data back to be analyzed. The problem is even when deferred or loaded asynchronously JavaScript can delay loading of web page content. If the third party server is slow or even worse an error occurs, the web page can actually hang, stranding the shopper in cyberspace limbo.
Third Party Performance Metrics
While website outages during high traffic periods garner the headlines website slowdowns are ten times more likely than outages (Godskind 2010).
Gallino et al. (2018) found that a 10 percent decrease in website performance leads to a 2.6 percent decrease in decrease in retailers’ revenue and a decrease of 0.05 percentage points in conversion. Gallino found a 10 percent increase in the number of hosts increased load times by 1.78 percent. Gallino and company also found that decreased website performance impacts revenue and conversion rates more for mobile than desktop.
The average webpage requires 90 to 98 HTTP requests to load as of Jan. 1, 2019 (HTTParchive.org). The average ecommerce site uses 85 third party services, so one web page can require up to 300 HTTP requests to over 100 servers to fully load. By the time the page loads the poor shopper can lose patience and leave the site.
Third Party Services Increase Performance Variability
While research has found that the number of objects on a web page is strongly correlated with page load times, the variability of load times is strongly correlated with the number of servers required to load a web page. Third party services by definition are deployed from external servers so they not only increase load times but increase the variability of load times. Variable load times are harder to “attune” to according to research from Chris Roast “attunability” studies (Roast 1998).
One reason why third party services increase response time variability is that external servers can have inconsistent response times themselves. By replacing third party services with first party services on the origin server, companies can improve load times and more importantly decrease and better control performance variability.
Analyzing Third Party Services
There are tools available to help quantify and analyzie third party services in websites. Speedcurve.com uses Web Page Test over time to create “speed curves” of websites. Speedcurve also created a proprietary third party analysis module specifically to analyze third parties. Webpagetest.org can show and exclude third party services with some additional work.
Conclusion
The use of third party services is growing at a rate of nearly 42% per year. The reliance of third party services is increasing load times (number of objects) and performance variability across the Web (number of servers). This trend is especially important for eCommerce sites where a 10 percent decrease in website performance leads to a 2.6 percent decrease in retailers’ revenue and a decrease of 0.05 percentage points in conversion. To improve performance minimize the use of third party services, roll your own on-domain equivalents, or employ lower impact third party services instead.
Further Reading
- Butkiewicz M, Madhyastha HV, Sekar V (2011) “Understanding website complexity: Measurements, metrics,
and implications.” - Proceedings of the 2011 ACM SIGCOMM Conference on Internet measurement conference, 313{328 (ACM). Found that the number of objects and the number of servers are the dominant indicators of page load time and variability in page load times, respectively. Non-origin or third party services increase the number of external servers required to render web pages. Analytics, advertising, tracking cookies, services/widgets, CDN, social networking, and programming APIs were the top third party services found.
- Gallino, Santiago, Nil Karacaoglu, and Antonio Moreno. “Why Retailers Should Care about Net Neutrality: The Impact of Website Performance on Online Retail.”
- Working Paper, October 2018. Analyzing data from seven different major online retailers Gallino et al. found that that a 10 percent decrease in website performance leads to a 2.6 percent decrease in revenue and a decrease of 0.05 percentage points in conversion, While slow website performance impacts both desktop and mobile browsers, the effect on sales and conversion rates was more pronounced for mobile.
A 10 percent increase in load time leads to a 2.9 percent decrease in retailers’ daily revenue in the mobile channel and a 1.8 percent decrease in the desktop channel. Conversion rates were also impacted in both channels by slower load times. The relative effect is stronger for the mobile channel.
“A 10 percent increase in load time leads to a 0.03 percentage point decrease in conversion in the mobile channel, while it decreases conversion in the desktop channel by 0.05 percentage points. Average conversion levels are 1.7 percent and 3.8 percent for the mobile and desktop channels, respectively. Thus, although the speed increase causes a smaller percentage point decrease in the mobile channel, the relative decrease in conversion in the mobile channel is larger relative to the desktop channel.”
Found a 10 percent increase in the number of hosts increases load times by 1.78 percent. They recommend that companies should carefully select their third party content provides and reduce the number of hosts to optimize website performance.
- Godskind, K. and Simic, B. (2010), “Online Performance Is Business Performance,”
- TRAC Research (for AlertSite). Goel et al. (2017) found that third party hosts can increase load times. Replacing third party resources with first-party resources can cut load times signicantly.
- Roast, C., “Designing for Delay in Interactive Information Retrieval.”
- Interacting with Computers 10 (1998): 87-104. Introduced the notion of attunability. Consistency in response rates is important for user satisfaction.
- Wang XS, Balasubramanian A, Krishnamurthy A, Wetherall D (2014) “How speedy is spdy?”
- NSDI, volume 1, 1. Wang et al. loaded web pages a thousand times under the same settings. Even though the website providers didn’t alter their webpage, they found a high variance in website performance. They found that this variability was due to browser computation.
- Yottaa, 2018. “2018 eCommerce 3rd Party Technology Index.”
- Analyzed over 1000 ecommerce websites using Yottaa’s eCommerce Acceleration Platform for third party usage of the top 200 most popular third party services. Found high saturation for Google, Facebook, and Bing third party services like analytics, tag management and social media. Listed the top offenders in personalization, tag management, ad tech, social media and customer reviews. Rated each third party service in website performance impact.