
In our January Bandwidth Report we looked at broadband penetration worldwide and for US states. This month we take a look at the effect of surfing the web using a mobile device. Using a mobile device to surf the same websites has an average page load time penalty of 50%, according to a recent survey.
Worldwide Mobile Broadband Speeds
In the third quarter of 2013, a provider in Russia once again led all countries surveyed with the fastest average mobile broadband speed of 9.5Mbps. The Ukraine came in second at 8.7Mbps. 18 of 76 providers surveyed had average mobile connection speeds of greater than 4Mbps (broadband), up from 11 providers in Q2. 74 providers had connection speeds greater than 1Mbps, up from 62 in Q2 2013. A South African mobile provider had the slowest average connection speed of 0.6Mbps. So mobile broadband speeds are increasing, but there are still areas with speeds 15 times slower than the fastest areas.
The Mobile Broadband Page Load Penalty
In June 2013, Akamai introduced the latest release of its Aqua Ion solution, designed to help optimized the desktop and mobile experience. One component of Aqua Ion is Real User Monitoring (RUM) which takes passive performance measurements from real users across its network. RUM can measure page load times across countries and across different platforms. Figure 1 shows the results of average page load time measurements across different countries (see Figure 1).
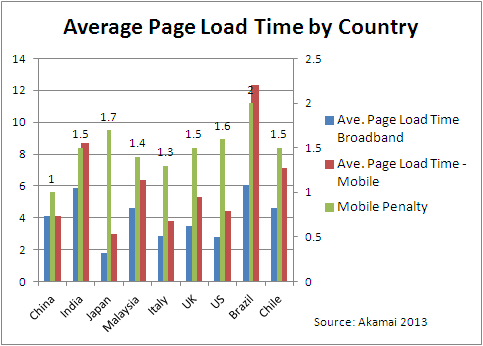
Figure 1: Average Web Page Load Time by Country and Platform
Source: Akamai
The results roughly correlate with the average and peak connection rates measured for each country. However, the “mobile penalty,” that is the decrease in page load time from desktop to mobile, varies from 1X to 2X. China had essentially the same load time across desktop and mobile platforms, while Brazil saw page load times 2 times as slow on mobile than they were on desktop devices. The average mobile penalty across all countries surveyed was 1.5 or 50%.
Mobile Web Page Optimization
The results above clearly show the need to optimize web sites for mobile devices. As we learned at the NYC Velocity conference, hiding elements for mobile devices doesn’t always prevent their loading. So even though some desktop elements are hidden on mobile devices, they may still load, slowing down the page for mobile devices.
Conclusion
The average “mobile penalty” for page load times is 1.5X. In other words web pages loaded on mobile devices load about 50% slower than their desktop counterparts. These results show the need to better optimize mobile websites and responsive designs.
Further Reading
- Akamai
- Akamai’s State of the Internet report for Q3 2014 was released in late January 2014. Contains mobile connection speed data and page load time data used in this report.
- Velocity NYC 2013 Highlights
- The first Velocity Web Performance conference held in New York City was chock full of interesting talks and hands-on workshops. One highlight was the importance of mobile performance, and the proper way to hide elements for mobile devices.