
The Web has changed dramatically over the past seven years. During that time the Web has moved from a static one-way medium toward a dynamic platform for interactive services such as photo and video sharing portals. In a comparative survey of data traces served over the Web from 2000 and 2007, University of Twente researchers found that the nature of web sites has changed (Sadre and Haverkort, 2008).
Where in 2000 nearly all traffic volume was caused by traditional HTML formats of images and HTML, in 2007 nearly all the traffic volume was made up of videos and binary software updates and downloads. Due in this shift toward larger videos clips and binary downloads the mean response size has increased from 12,294 to 68,275 bytes, a factor of 5.5 times larger (see Figure 1). The caching efficiency of the Web has decreased while dynamic responses have increased from 21.2% to 37.1%. These changes show how the Web has shifted from static information to dynamic rich media.
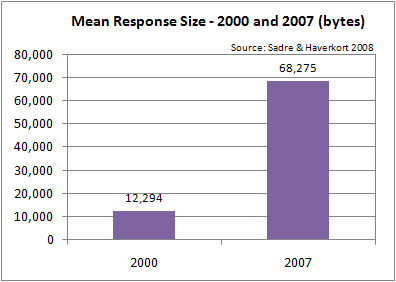
Figure 1: Growth of the Mean Object Size
Mean Web Object Size Quintuples Since 2000
Table 1 shows how response size statistics have changed between the 2000 and 2007 traces. The mean response size grew 455% from 12,294 bytes to 68,275.2 bytes, or some 5.5 times larger. The median response size grew from 2,410 bytes to 2,780 bytes. Both traces show a heavy-tailed distribution, with the 2007 even more heavily tailed. This effect can be seen in the order of magnitude increase in the Squared Coefficient of Variation of the response size distribution (SCV) from 320.9 to 3,425, as well as an increase in the largest documents observed. The largest document observed in a 2004 trace had a size of 193 Mbytes, whereas the largest file in the 2007 trace had a size of around 2 Gbytes showing that the 2007 trace was even more heavy tailed with a much larger distribution of larger objects.
| 2000 trace | 2007 trace | |
|---|---|---|
| min | 17 | 85 |
| max | 0.228 · 109 | 2.147 · 109 |
| mean | 12294.0 | 68275.2 |
| median | 2410 | 2780 |
| SCV | 320.9 | 3425.1 |
Popular Object Type Evolution
Table 2 shows the diversification of object distribution over the years. In 2007 the top 5 object types accounted for 88.2% of all requests, while fully 98.1% of requests were accounted for by the top five types in 2000. Table 2 also shows the increased popularity of the JPEG and PNG formats away from the GIF format. Only .2% of all requests were for JPEGs in 2000 while one-third (33.3%) of all requests were for JPEGs in 2007. Table 2 also shows a shift towards more interactive applications with an increase in the use of JavaScript from 1.1% of all requests in 2000 to 6.9% in 2007. CSS use is also on the rise, with 2.7% of HTML documents using CSS in 2000 while 15.6% of HTML documents used CSS in 2007.
|
|
Traffic Volume and Size
Table 3 shows that while nearly all the traffic in 2000 was caused by traditional HTML formats of images and HTML in 2007 nearly all the traffic volume was made up of videos and binary software updates and downloads. Table 3 also shows the dramatic increase in the average file size of objects, even HTML and JPEGs have increased by 30%.
|
|
Average Page Size and Number of Requests
The number of requests per client has more than doubled from 7074 requests in 2000 to 14,670 requests in 2007, while the average page size (despite what page delimeter threshold delay was used to delineate a page from proxy traces) has doubled from 2000 to 2007.
Caching and Dynamic Pages
The caching efficiency has decreased dramatically from 2000 to 2007 with 54.3% hits in 2000 to 23% hits in 2007. This is due in part to the more dynamic nature of the Web. In 2000 only 21.2% of all URLs were requests for dynamic documents (form, cgi requests, etc.) while 37.1% were dynamic requests in 2007.
Further Reading
- Average Web Page Triples Since 2003
- Within the last five years, the size of the average web page has more than tripled, and the number of external objects has nearly doubled. While broadband users have experienced somewhat faster response times, dial-up users have been left behind.
- Sadre, R., and B. Haverkort, 2008. “Changes in the Web from 2000 to 2007,”
- DSOM 2008, 136-148. In a comparison of data traces from 2000 and 2007, University of Twente researchers found that the nature of data distributed over the World Wide Web has changed. Object size and object type distribution show that the Web has moved from a static one-way delivery platform to a more dynamic and interactive medium.