For his doctoral thesis at the University of Glasgow, Thiam Kian Chiew studied web page performance. As part of his research, Chiew explored the different factors that affect web page speed, testing and modeling the key components to web page download times. His findings are summarized below.
Web Page Performance vs. Server Performance
Unlike most research into web performance that deals with server and network issues, Chiew’s thesis focused on the performance analysis of web pages themselves. The key metric with web pages is response time. Instead of being the result of server and network conditions, Chiew treats response time as an attribute of web pages. To address response time, Chiew proposes a framework of measurement, modeling, and monitoring. These “3Ms” were addressed with corresponding software modules. Using this framework, web developers can assess that web pages can meet or reduce tolerable wait times to ensure higher user satisfaction with web sites.
Response Time Guidelines
Web page response time is the most straightforward metric in quantifying user satisfaction (Hoxmeier & DiCesare, 2000). But as bandwidth and user experience have increased, the guidelines for web page response times have evolved. Schneiderman established in the 1980s that 1-2 second response times were ideal and that 15 seconds was a tolerable wait time (TWT – Schneiderman 1984). As the Internet and the Web emerged into the general modem-toting public in the 1990s, longer response times were tolerated, on the order of 8-12 seconds without feedback, and 20 to 30 seconds or more with feedback (King 2003). In 1996 Jacob Nielsen wrote that 10 seconds was the maximum response time before a user loses interest (Nielsen 1996). Zona Research published an oft-cited study for Akamai that offered the 8 second rule (Zona 1999). In early 2003, my first book found that the average TWT was 8.6 seconds, for the current conditions (King 2003).
As bandwidth has increased (more than 63% of the US is now on broadband), so have user expectations towards response times. While the average web page size and complexity have increased significantly since the 1990s to over 315K and 50 total objects, users expect faster response times with their faster wireless and broadband connections. The current guidelines on response times have split into faster response times for broadband users (3-4 seconds) and slower response times for dial-up users (on the order of 8-10 seconds). Thus the need for responsive web sites is that much greater. Towards that end this research provides test results to compare different optimization techniques, as well as software tools for modeling and monitoring web page performance.
Summary of Contents
The thesis tests the following hypothesis:
- The response time of downloading a Web page can be decomposed into its constituent components.
- The particular Web page response time will be affected by identifiable characteristics of the Web pages.
- It is possible to provide recommendations for resolving or relieving some of the identified performance problems that may cause poor response time based on the identified characteristics that affect Web page response time.
Beyond the introductory remarks, the thesis is organized into eight Chapters:
- Chapter 2: Background
- This Chapter provides background information and research into computer system performance as it relates to the Web. Explores the history of the Internet and the Web, response time research, and how this research relates to the Web.
- Chapter 3: Problem Statement.
- States the problems to be addressed and the framework as well as approaches for addressing the problems.
- Chapter 4: Measuring and Decomposing Web Page Response Time.
- This chapter introduces two Web page response time measurement methods (the Muffin proxy, and the Frame method), which allow response time to be decomposed into three of its constituents, i.e. generation, transmission, and rendering.
- Chapter 5: Modelling Web Page Response Time.
- This chapter explains the complexity of Web pages from two perspectives: creation and content.
- Chapter 6: Monitoring Web Page Response Time.
- This chapter shows how Web page response time and responsiveness can be monitored and estimated based on server access log analysis. A prototype of such a tool is developed.
- Chapter 7: Making Use of Measurement, Modelling, and Monitoring To Enhance Web Page Performance: An Example.
- Describes two scenarios to show how the measurement, modelling, and monitoring modules can be used in Web page design to produce Web pages that deliver satisfactory response times. An analyzer is presented.
- Chapter 8: Conclusion.
- Gives an overview of the thesis and discusses the results, limitations, and future work.
- Chiew, T. K., 2009, “Web Page Performance Analysis,”
- Ph.D. Thesis, University of Glasgow, Department of Computer Science. March 24, 2009.
- Hoxmeier, J. A., & DiCesare, C. (2000). “System Response Time and User Satisfaction: An Experimental Study of Browser-based Applications,”
- In Proceedings of the 4th CollECTeR Conference on Electronic Commerce, Breckenridge 11 April 2000.
- King, A. 2003, Speed Up Your Site: Web Site Optimization,
- New Riders Press, 2003. Chapter 1: Response Time: Eight Seconds, Plus or Minus Two.
- Nielsen, J. 1996, “Top 10 Mistakes in Web Design,”
- Available from: http://www.useit.com/alertbox/9605a.html May 2006. Accessed July 30, 2009.
- Schneiderman, B. 1984, “Response Time and Display Rate in Human Performance with Computers,”
- Computing Surveys 16, no. 3 (1984): 265-285. Keep it under 1 to 2 seconds, please.
- Titchkosky, L., Arlitt, M., and Williamson, C. 2003, “A Performance Comparison of Dynamic Web Technologies,”
- ACM SIGMETRICS Performance Evaluation Review, 31 (3): 2-11.
- Yuan, J., Chi, C.H., and Q. Sun, “A More Precise Model for Web Retrieval,”
- WWW 2005, May 10-14, 2005, Chiba, Japan. The researchers found that the Definition Time (DT) and Waiting Time (WT) of objects have a significant impact on the total latency of web object retrieval, yet they are largely ignored in object-level studies. The DT and WT composed from 50 to 85% of total wait time, depending on the number of objects in a page. Above four objects per page, “object overhead” dominates web page latency.
- Zona, 1999, “The Need for Speed,”
- July 1999. Research Report: Zona Research.
Server-Side Tuning
The author discusses server-side and network performance techniques such as caching, prefetching, content delivery networks, load balancing, and server tuning briefly. The main focus of the paper is client-side measurement and optimization, however. He compares PHP, Java Servlets, and Enterprise Java Beans software for generating dynamic web content and finds that PHP is the most efficient of the three architectures, but has limited functionality and runtime support. PHP handles small dynamic content requests well (2KB response size) but does not cope with large (64KB size) requests well. Java servlets perform better with dynamic content than with serving static content.
The Overhead of Dynamic Content
There is a significant amount of overhead in serving dynamic content (Titchkosky et al., 2003). Titchkosky found that the overhead of serving dynamic content reduced the peak rate of Apache 1.3x by up to 8 times, depending on workload conditions and the software used (see Table 1).
| Type of Response | Peak Rate (Responses/Second) |
|---|---|
| 2kB Static File | 4, 000 |
| 64kB Static File | 1, 400 |
| 2kB Dynamic (PHP) File without Database Access | 1, 400 |
| 64kB Dynamic (PHP) File without Database Access | 250 |
| 2kB Dynamic (PHP) File with Database Access | 850 |
| 64kB Dynamic (PHP) File with Database Access | 250 |
In actual tests of instrumented web pages the author found the effects of different techniques (see Table 2).
| Factor | Improvement |
|---|---|
| No DNS Lookups (IP vs. Domain) | 11% |
| Employ Caching | 19.3% |
| Use Static vs. Dynamic (JSP) pages | 51.8% |
The Effects of Web Page Complexity
In terms of content, web page complexity is largely made up of the number of embedded objects in a web page, and its total size. The number of objects in a web page determines the number of round trip requests required to a server from a client. With the average number of embedded objects now over 50 per web page, object overhead now dominates the latency of most web pages (Yuan 2005). The author set about to test the web page attributes that contribute to response times, including lines of code, embedded objects, total page size, and JavaScript and CSS usage.
Lines of Code
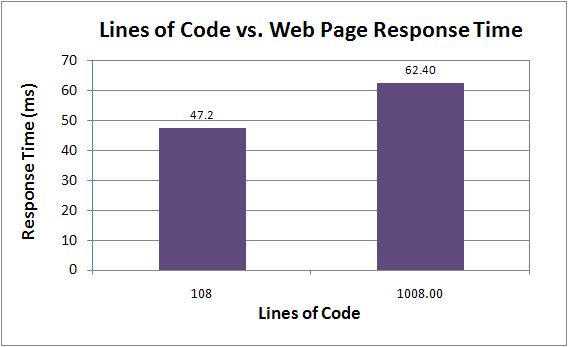
The amount of HTML code affects the response time of a web page, but not as much as the number of embedded objects or total page size. For similar pages with different number of lines of code, response time grew somewhat. Growing from 108 lines of code to 1008 lines of code (833% more lines of code), response time grew from 47.2 ms to 62.4ms on average, or only 15.2ms or 32.2%. So for a 100% increase in lines of code, response time would grow by 3.8%. This shows that longer pages with the same page size will have slightly longer response times than shorter pages of the same file size. Of course, HTTP compression can reduce the effects of large textual data by 70 to 75%.
Figure 1: Lines of Code vs. Web Page Response Time

Embedded Objects
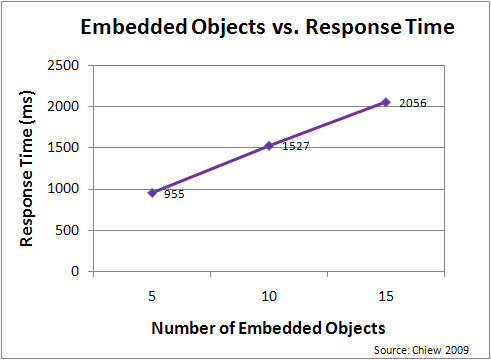
The response time of a web page grows in proportion to the number of embedded objects in the page (see Figure 2). For similar pages with 5, 10, and 15 embedded objects the response times increased nearly linearly with the number of embedded objects from 955 ms, to 1527ms, to 2056 ms respectively. So a 200% increase in embedded objects (from 5 to 15 objects) gave a 113% increase in response time (from 955 to 2056 ms). So on average a 100% increase in embedded objects would yield a 56.5% increase in response time.
Figure 2: Embedded Objects vs. Web Page Response Time

Total Page Size
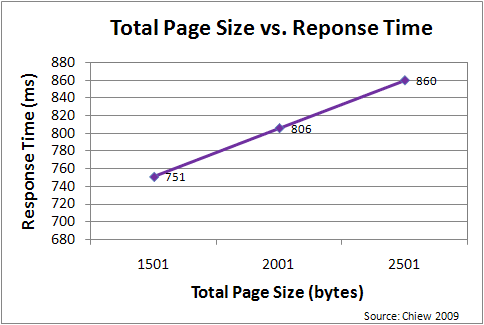
The response time of a web page is proportional to the total size of the page (see Figure 3). For similar pages with the same number of lines of code, response time grew linearly with total page size (see Figure 3). As page size grew from 1501, to 2001, to 2501 bytes, response time grew from 751, to 806, to 860 milliseconds respectively. So a 66.6% increase in page size (from 1501 to 2501 bytes) gave an increase in response time of 14.5% (from 751ms to 860ms). So a 100% increase in total page size would yield a 21.8% increase in response time. These figures show that, under the conditions of this test, embedded objects affect response times nearly 2.6 times more than total page size.
Figure 3: Total Page Size vs. Web Page Response Time

Chiew went on to test the effects of JavaScript, CSS, programming constructs, and database access. He found that opening a database connection is more time consuming than executing a query. He also tested the effect of cookies. He found that more session variables in a cookie does not have a significant effect on response time. Since cookies contain a small amount of textual information, more session variables mean a slightly larger text load, but still a small payload overall. Manipulating session variables however, does incur a performance cost.
Chiew went onto model web page complexity with six components, and created software modules to model, measure, monitor, and improve web page response times.
Conclusion
This research into web page performance quantifies what web page attributes effect response times the most. The most important factors in speeding up web page response times are minimizing the number of embedded objects and the amount of dynamic data. The number of embedded objects was 2.6 times more costly than total page size for response time. Caching was found to improve response times by over 19%. The number of lines of code and the size of cookies were found to affect response times the least.

Is it possible to read the whole thesis?
Andi,
Yes, you can read the thesis here Web Page Performance Thesis at the University of Glasgow.